Fig. 9.

Download original image
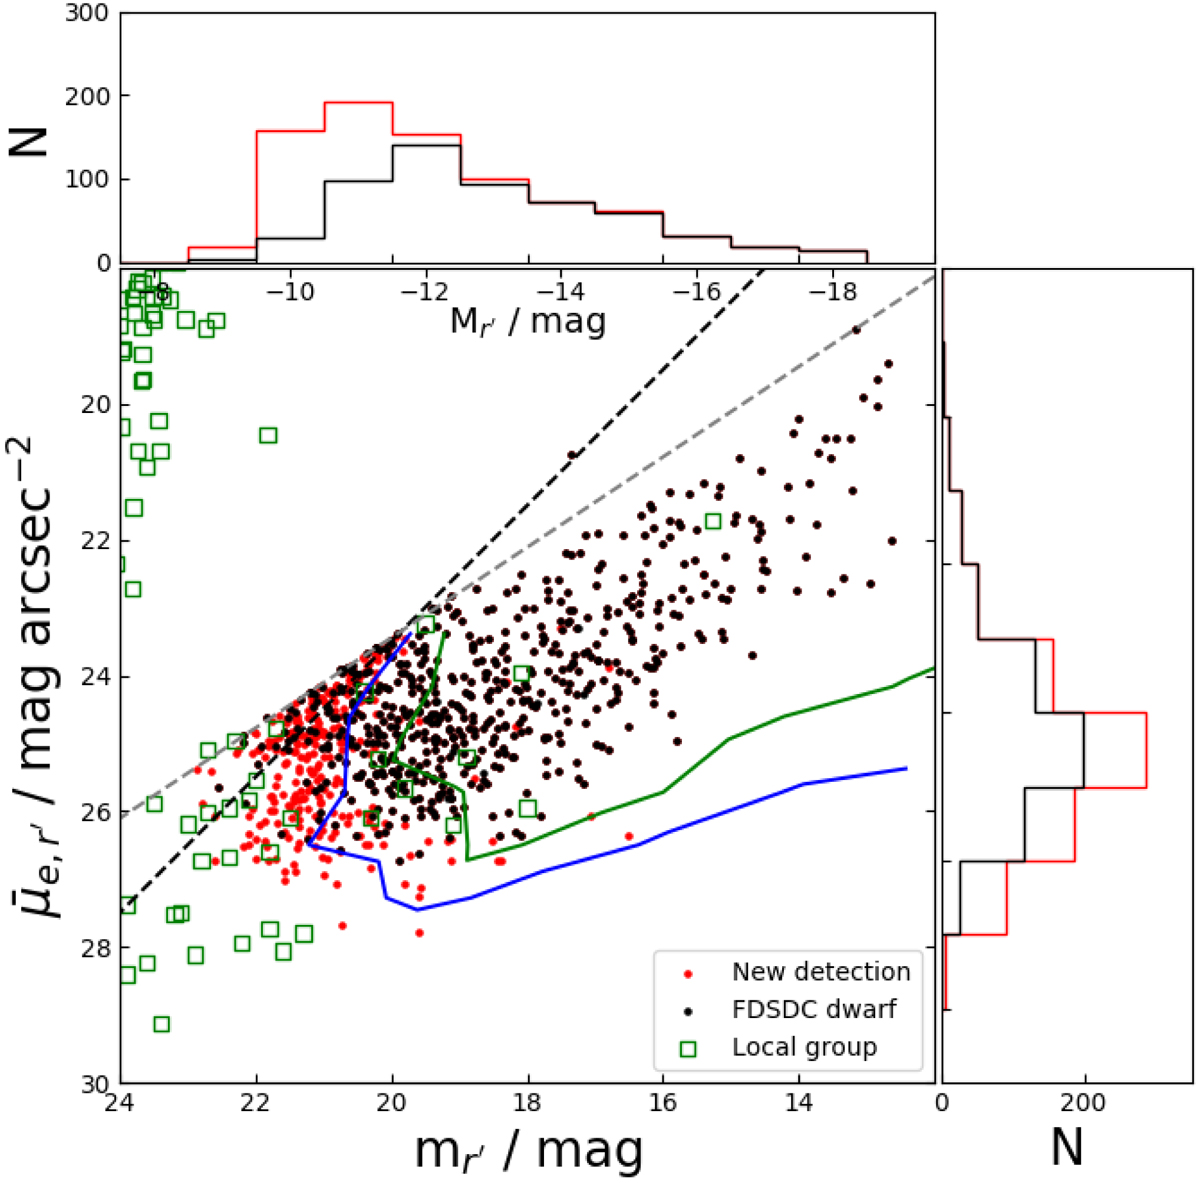
Surface brightness of Fornax cluster dwarfs. Apparent r′-band magnitudes (mr′) and mean effective SBs (![]() ) of the FDSDC galaxies (black symbols) compared with the LSB extension galaxies described in this work (red symbols). The histograms on the x and y axes show the distributions of the magnitudes and SBs with the same colors as in the scatter plot. The blue and green contours show the 50% and 75% detection limits found using the artificial galaxies (Sect. 3.2), and the black and dashed gray lines show the a > 2 arcsec and SB selection limits, respectively. There are also galaxies with Re < 2 arcsec as the selection was based on MTO detection a > 2 arcsec. For a comparison, we also show a sample of LG dwarfs and globular clusters (green squares clearly above these selection limits) from Brodie et al. (2011).
) of the FDSDC galaxies (black symbols) compared with the LSB extension galaxies described in this work (red symbols). The histograms on the x and y axes show the distributions of the magnitudes and SBs with the same colors as in the scatter plot. The blue and green contours show the 50% and 75% detection limits found using the artificial galaxies (Sect. 3.2), and the black and dashed gray lines show the a > 2 arcsec and SB selection limits, respectively. There are also galaxies with Re < 2 arcsec as the selection was based on MTO detection a > 2 arcsec. For a comparison, we also show a sample of LG dwarfs and globular clusters (green squares clearly above these selection limits) from Brodie et al. (2011).
Current usage metrics show cumulative count of Article Views (full-text article views including HTML views, PDF and ePub downloads, according to the available data) and Abstracts Views on Vision4Press platform.
Data correspond to usage on the plateform after 2015. The current usage metrics is available 48-96 hours after online publication and is updated daily on week days.
Initial download of the metrics may take a while.


