Fig. 7.
Download original image
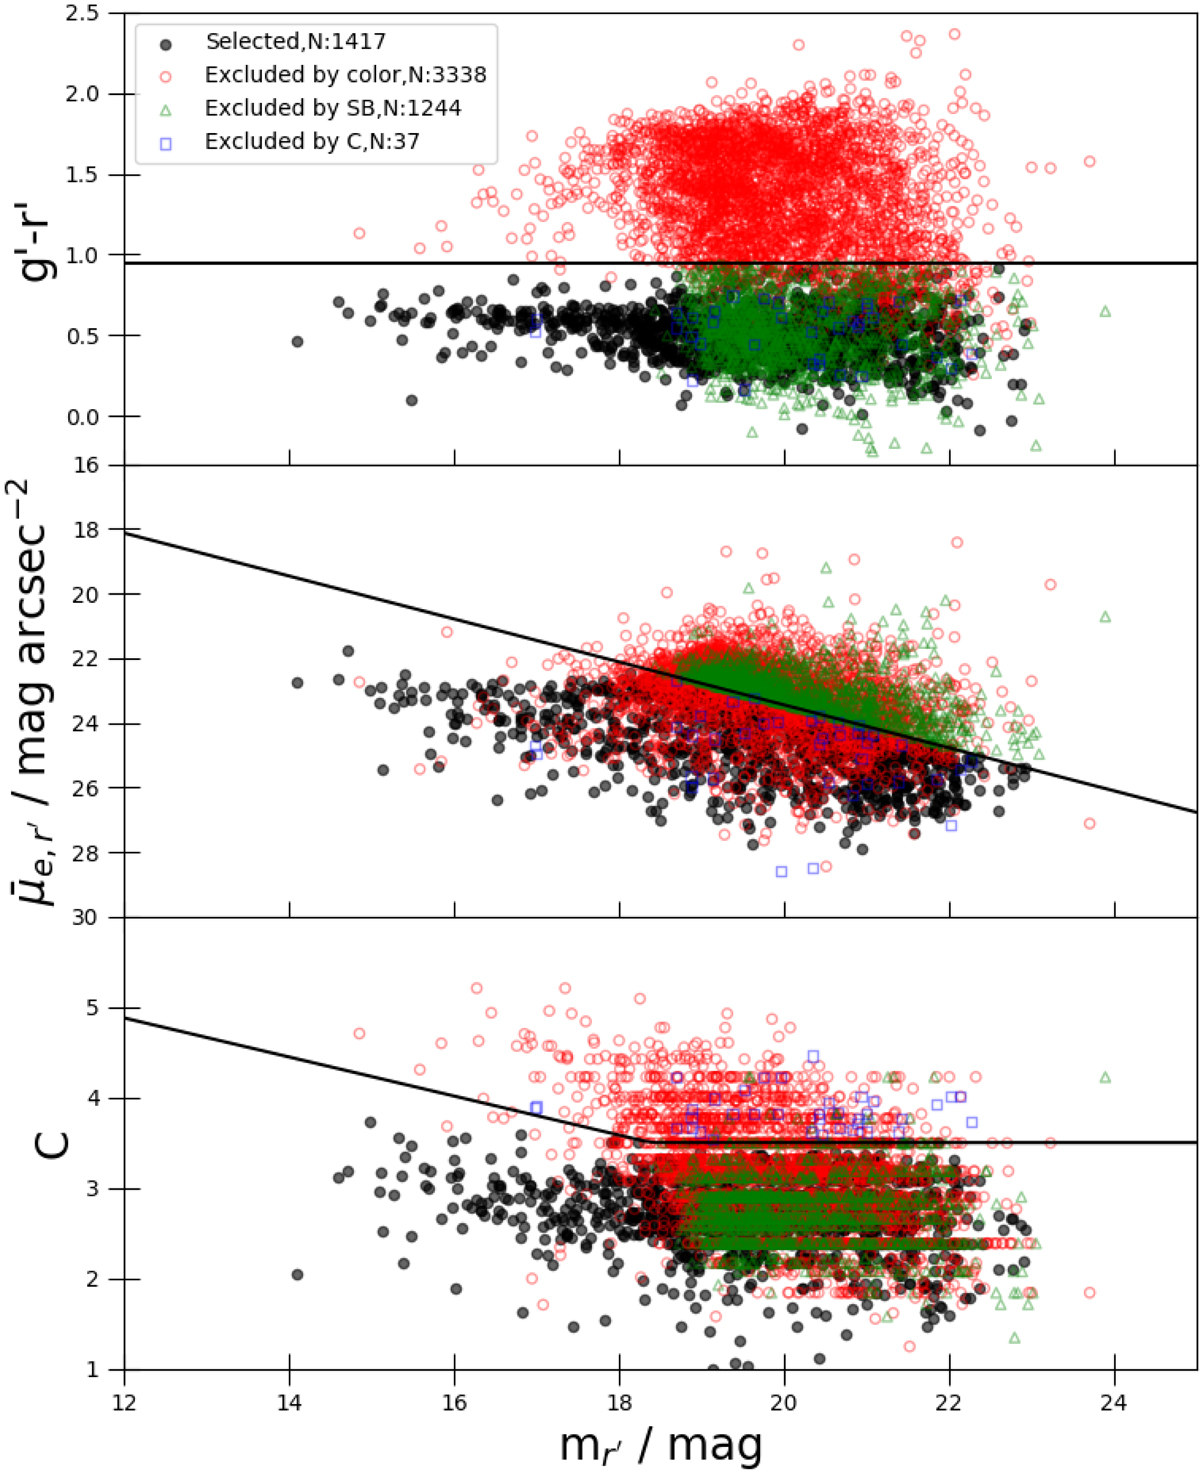
Parametric cuts used for the selection of LSB candidates. The panels show g′−r′ colors (top panel), SBs (middle panel), and the concentration parameter, C (bottom panel of the galaxies), as a function of their r′-band apparent magnitude, mr′. The selected galaxies (black symbols) and the galaxies rejected for being too red (red symbols), having too high of a SB (green symbols), and a too high C (blue symbols) are indicated with the different symbols. The black lines in the panels show the selection cuts (see the text and V18).
Current usage metrics show cumulative count of Article Views (full-text article views including HTML views, PDF and ePub downloads, according to the available data) and Abstracts Views on Vision4Press platform.
Data correspond to usage on the plateform after 2015. The current usage metrics is available 48-96 hours after online publication and is updated daily on week days.
Initial download of the metrics may take a while.