Fig. 6.
Download original image
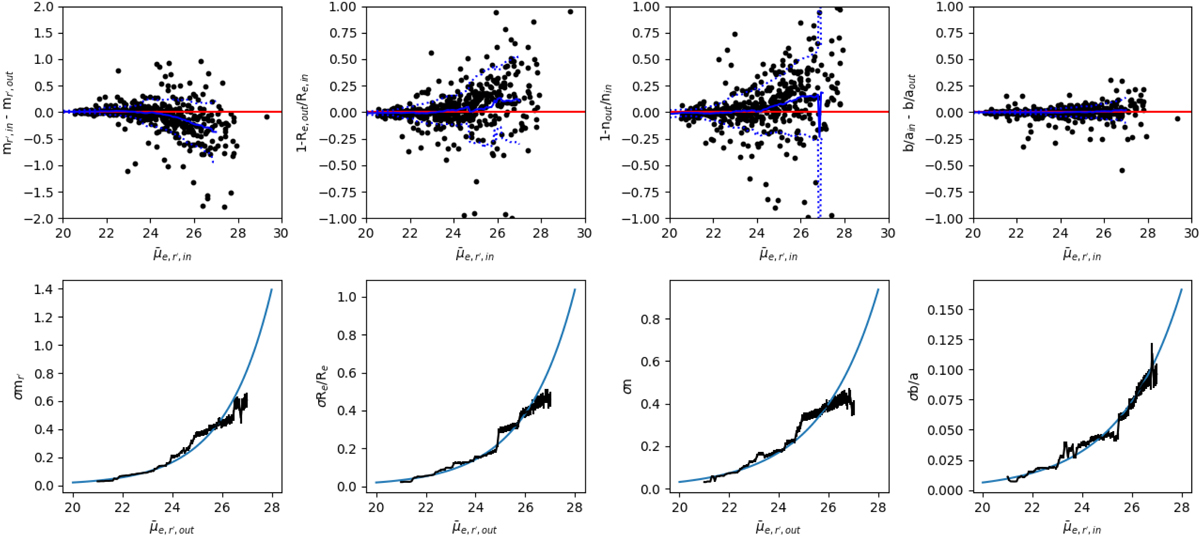
GALFIT parameter accuracy. Comparison between the input and output values of the structural parameters of the mock galaxies. The upper panel shows the differences between the input and output magnitudes (mr′), effective radii (Re), Sérsic indices (n), and axis ratios (b/a) as a function of input mean effective r′-band SB (![]() ). The black symbols show individual measurements, and the blue line shows the running mean with a 2 mag arcsec−2 filter size. The corresponding standard deviations are shown with the dashed blue lines. The lower panels show the magnitude of the standard deviations between the input and output values. The blue curves show the fits of Eq. (4) to the data.
). The black symbols show individual measurements, and the blue line shows the running mean with a 2 mag arcsec−2 filter size. The corresponding standard deviations are shown with the dashed blue lines. The lower panels show the magnitude of the standard deviations between the input and output values. The blue curves show the fits of Eq. (4) to the data.
Current usage metrics show cumulative count of Article Views (full-text article views including HTML views, PDF and ePub downloads, according to the available data) and Abstracts Views on Vision4Press platform.
Data correspond to usage on the plateform after 2015. The current usage metrics is available 48-96 hours after online publication and is updated daily on week days.
Initial download of the metrics may take a while.