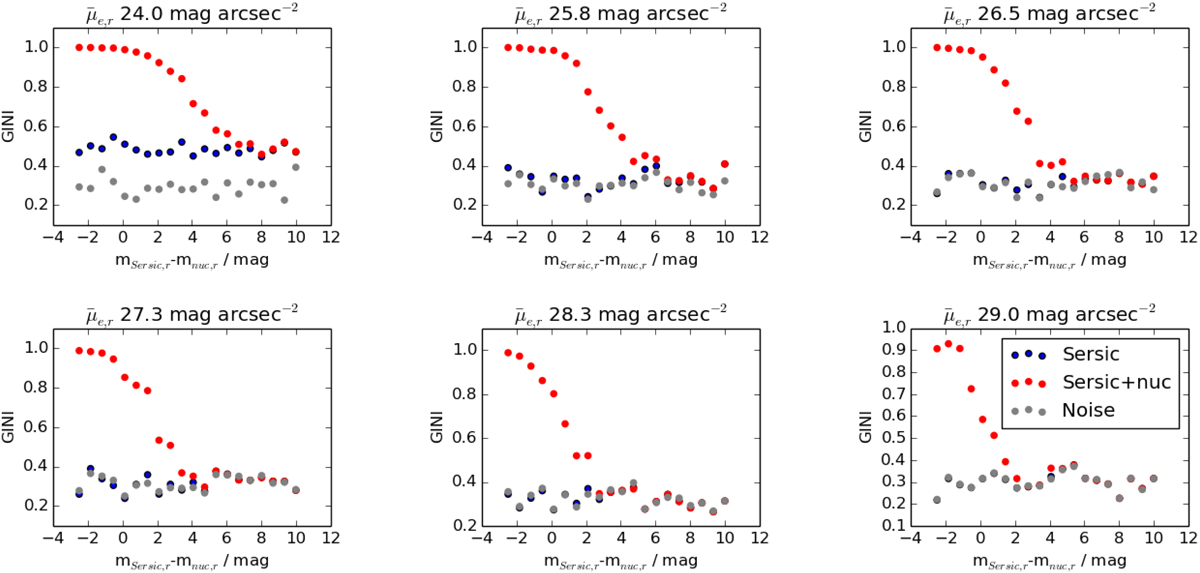
Fig. A.5.

Download original image
Limits of nuclear cluster detection. Gobj/GPSF calculated for an exponential profile (red symbols), a nucleated exponential profile (blue symbols), and noise (gray symbols). The values on the x axis indicate the difference between the total magnitude of the simulated nucleus and that of the galaxy, and thus those values are only relevant for the red symbols. For other symbols, the different locations on the x axis correspond to different realizations of the same galaxy. The panels show the Gobj/GPSF values for galaxies with different SBs.
Current usage metrics show cumulative count of Article Views (full-text article views including HTML views, PDF and ePub downloads, according to the available data) and Abstracts Views on Vision4Press platform.
Data correspond to usage on the plateform after 2015. The current usage metrics is available 48-96 hours after online publication and is updated daily on week days.
Initial download of the metrics may take a while.


