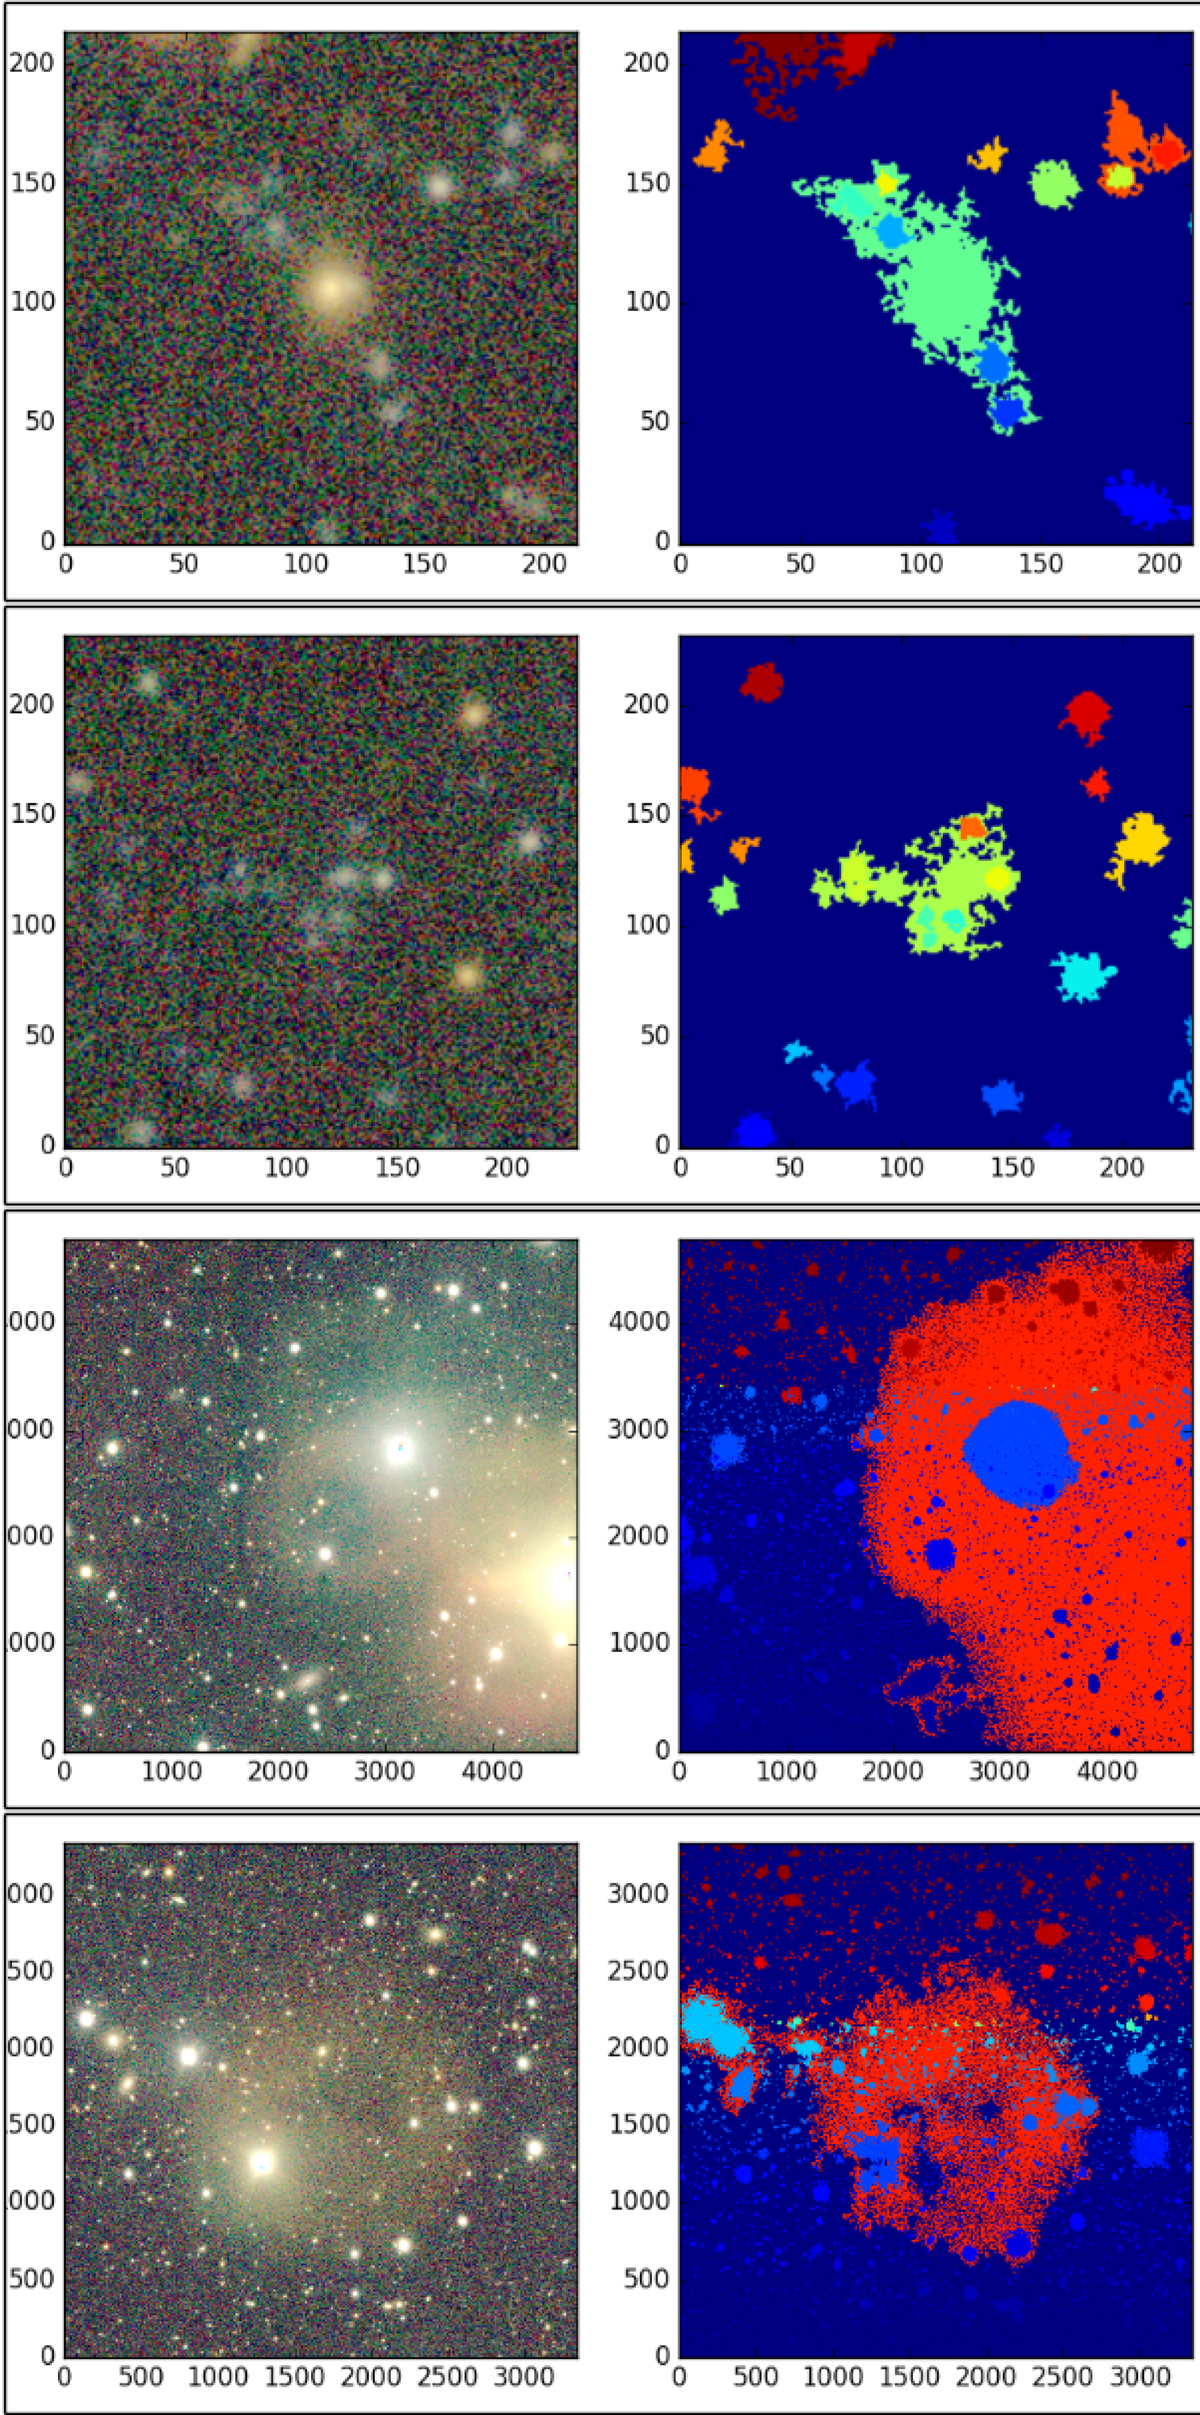
Fig. A.3.
Download original image
False positives. Examples of sources that appear as LSB galaxies in the MTO detection but have different physical natures. The left panels show color images generated from the FDS data, and the right panels show the segmentation maps, where different object labels are shown with different colors. The two upper examples show groups of galaxies that are connected on low SB levels and where the common LSB envelope is associated with one of the galaxies, making its mean SB low. The two lower panels show reflection rings around bright stars. Those objects have similar SBs as LSB dwarfs.
Current usage metrics show cumulative count of Article Views (full-text article views including HTML views, PDF and ePub downloads, according to the available data) and Abstracts Views on Vision4Press platform.
Data correspond to usage on the plateform after 2015. The current usage metrics is available 48-96 hours after online publication and is updated daily on week days.
Initial download of the metrics may take a while.