Free Access
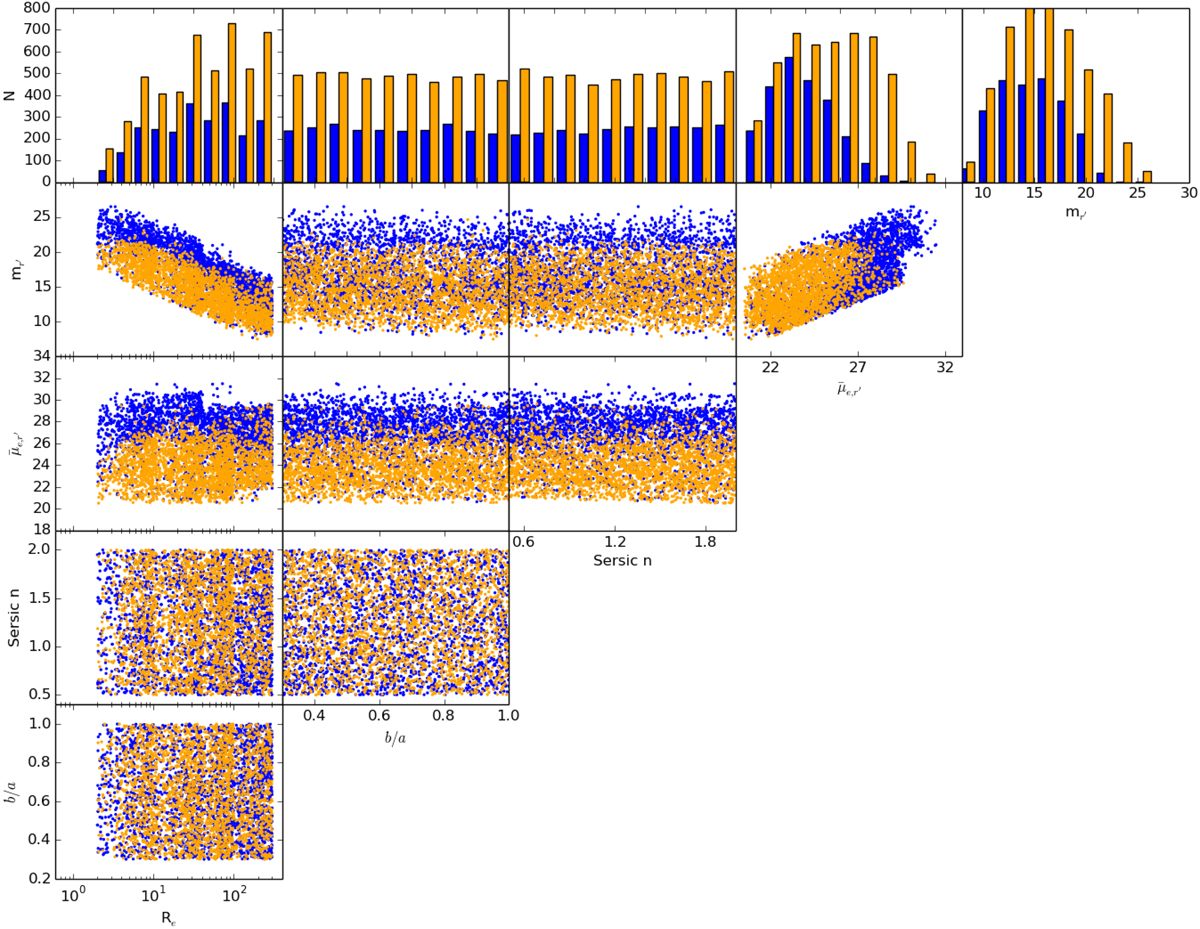
Fig. A.2.
Download original image
Detections (orange points) and non-detections (blue points) of the mock galaxies using MTO. The matrix plots show the distribution of galaxies in the different parameter subspaces. The upper histograms show the distributions of detected (orange) and all (blue) galaxies for the given parameters.
Current usage metrics show cumulative count of Article Views (full-text article views including HTML views, PDF and ePub downloads, according to the available data) and Abstracts Views on Vision4Press platform.
Data correspond to usage on the plateform after 2015. The current usage metrics is available 48-96 hours after online publication and is updated daily on week days.
Initial download of the metrics may take a while.