Free Access
Fig. 22.
Download original image
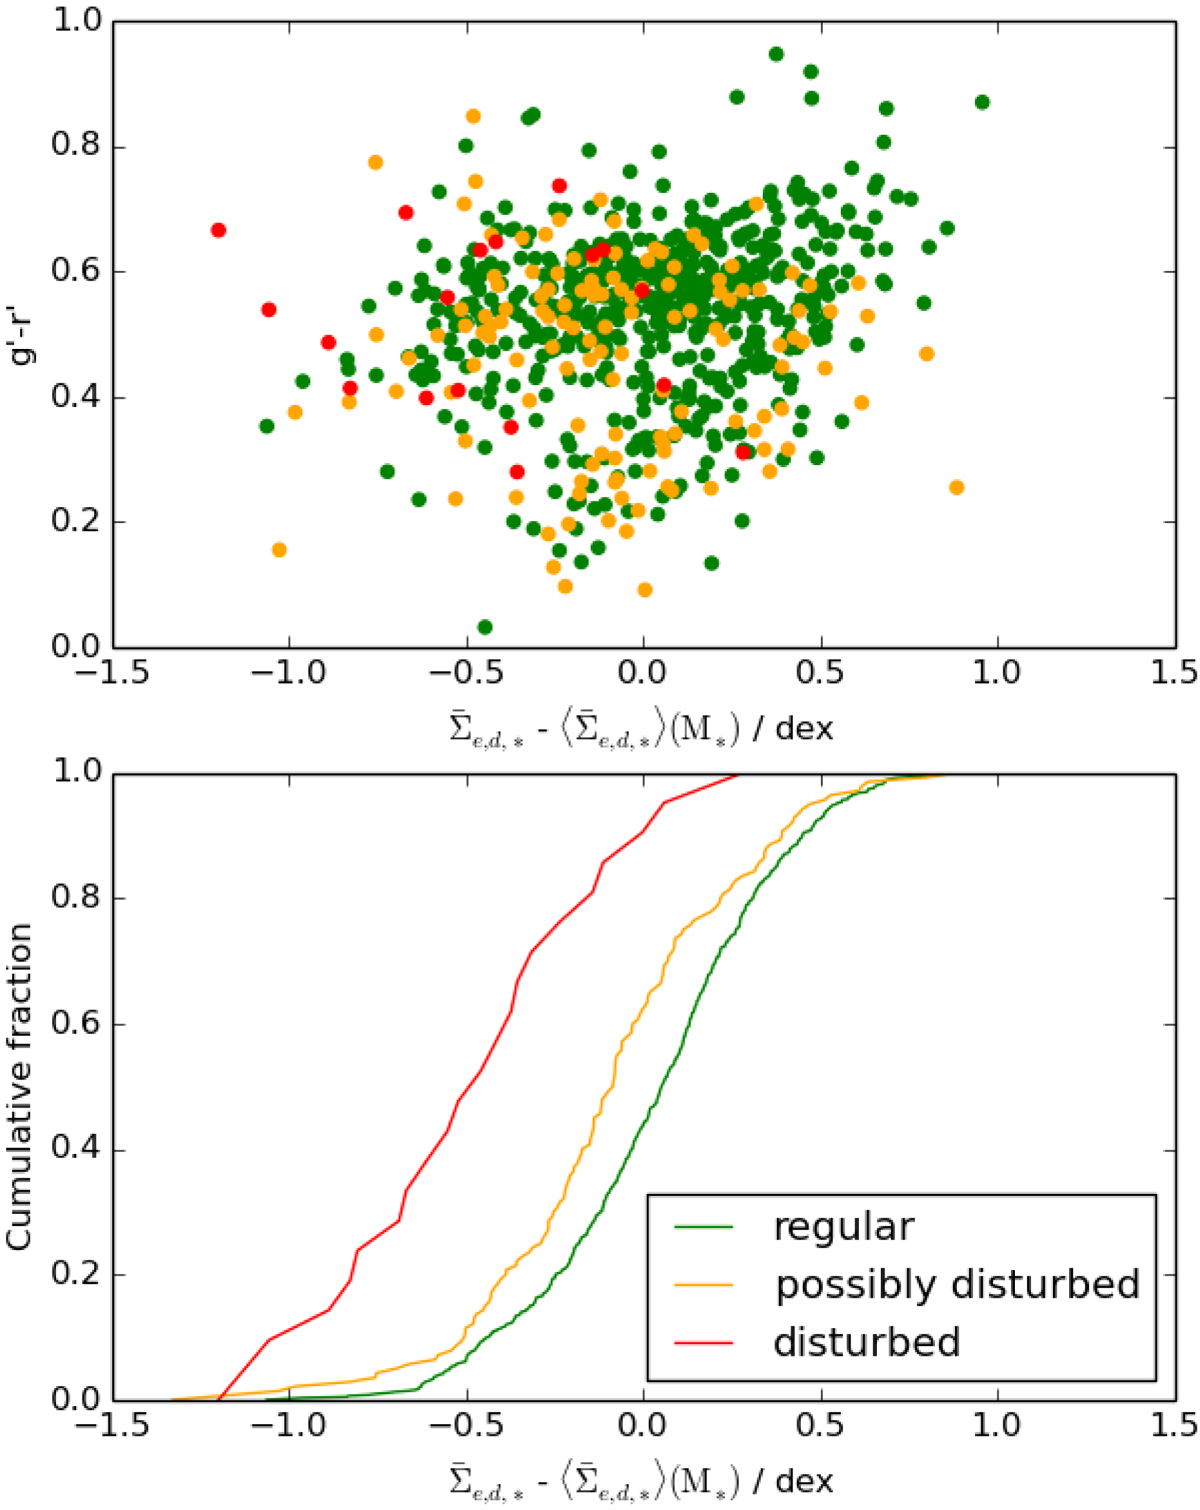
Relation between tidal morphology and surface density. Upper panel: Galaxy g′−r′ colors as a function of excess SD. The different colors correspond to galaxies with different amounts of disturbed morphology. Lower panel: cumulative distributions of the excess SD of the different morphological classes of the upper panel.
Current usage metrics show cumulative count of Article Views (full-text article views including HTML views, PDF and ePub downloads, according to the available data) and Abstracts Views on Vision4Press platform.
Data correspond to usage on the plateform after 2015. The current usage metrics is available 48-96 hours after online publication and is updated daily on week days.
Initial download of the metrics may take a while.