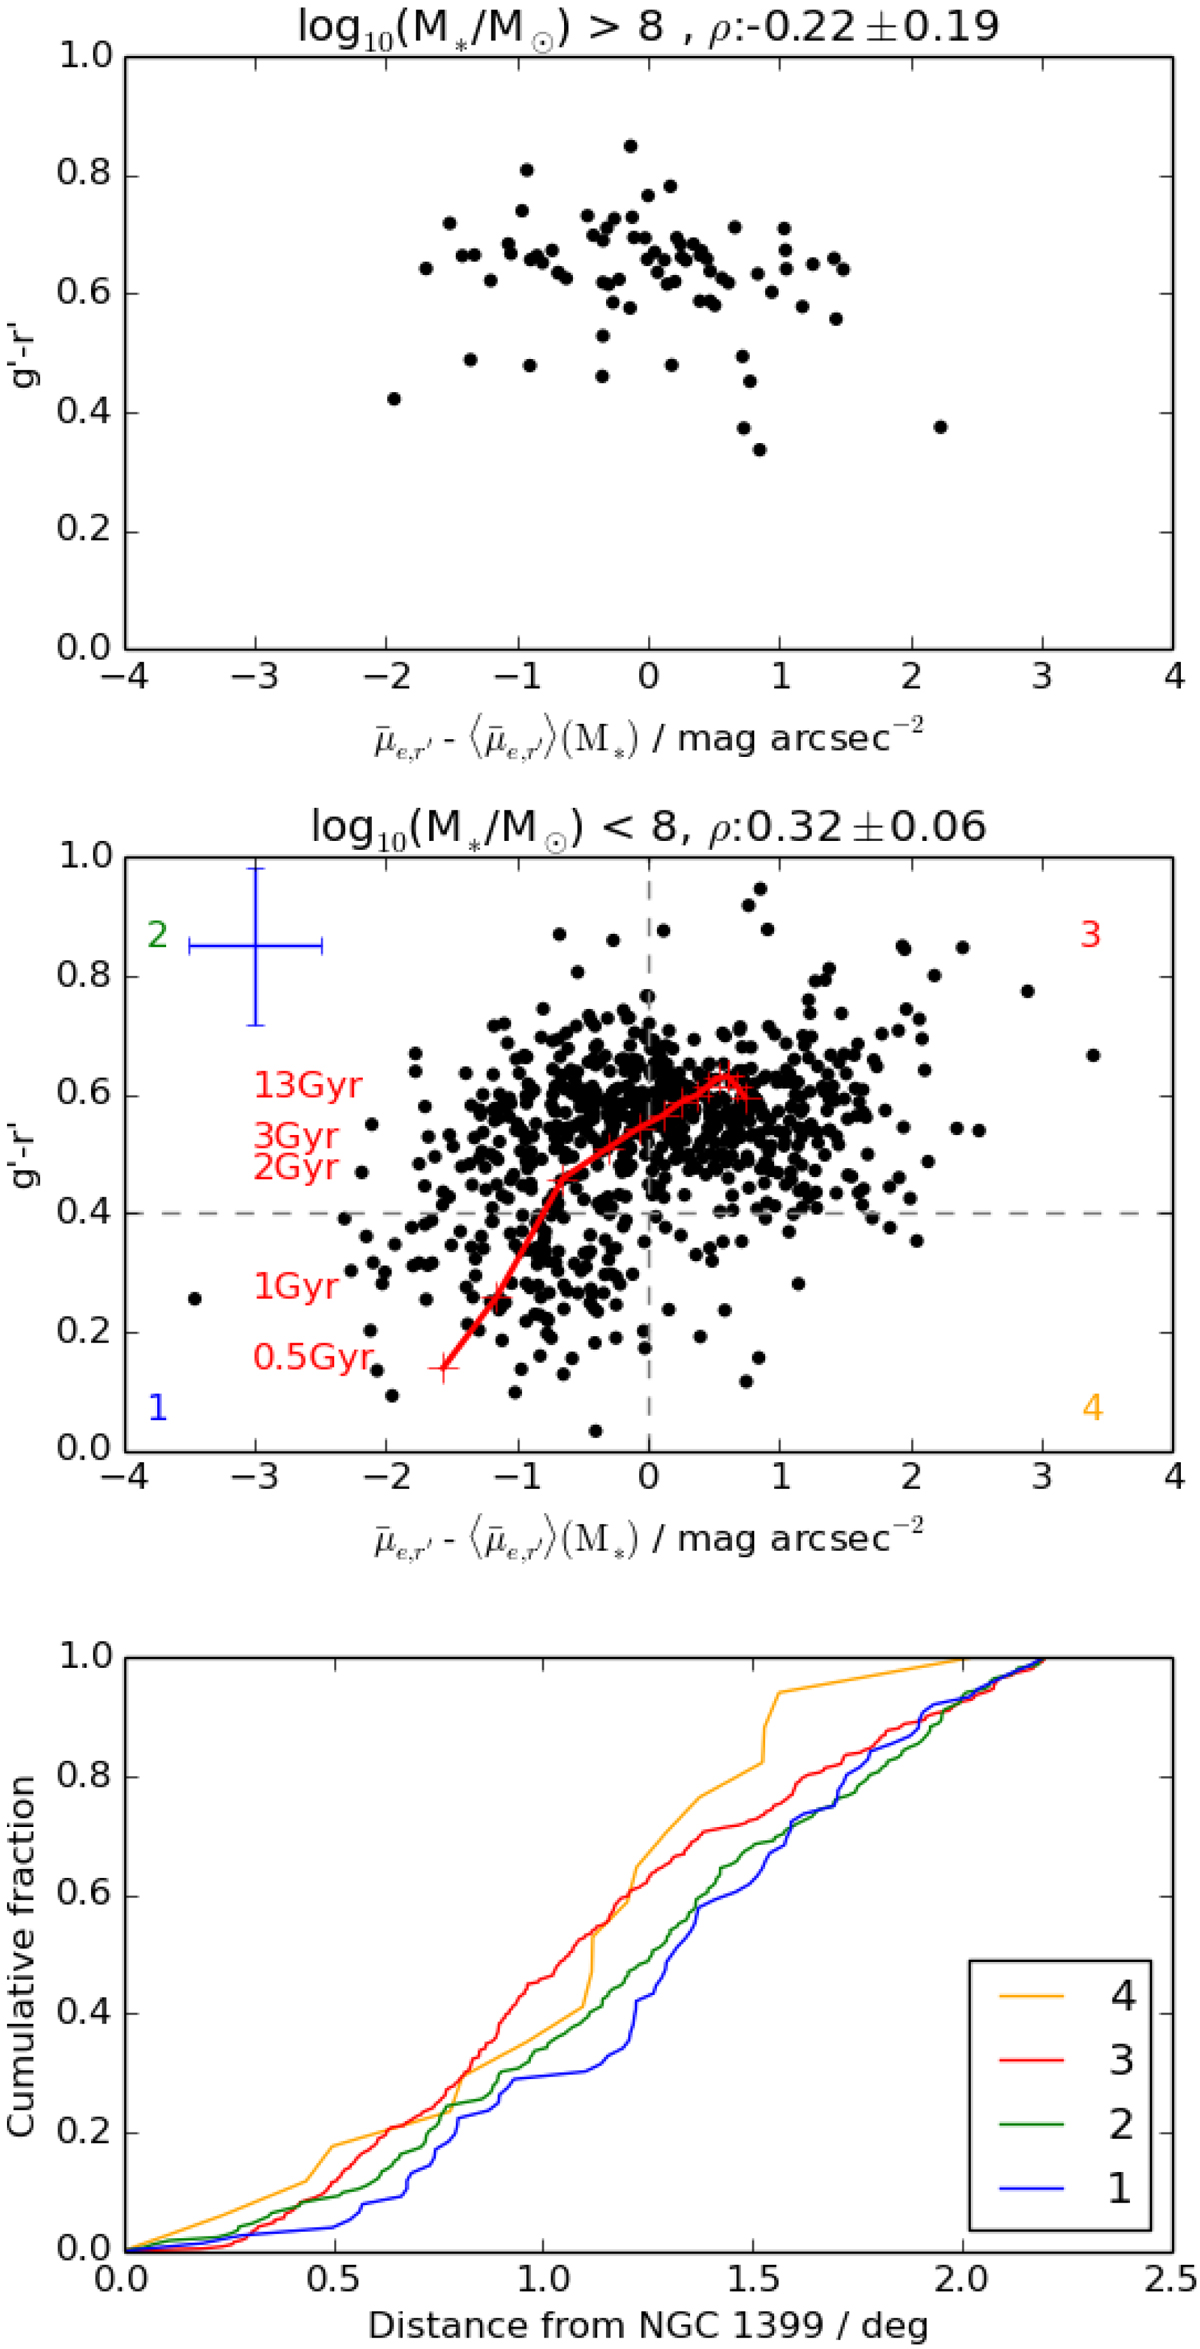
Fig. 21.
Download original image
Effects of stellar population ageing. Two upper panels: galaxy g′−r′ colors as a function of their excess mean effective SB. Top and middle panels: Dwarf galaxies with log10(M*/M⊙) > 8 and log10(M*/M⊙) < 8, respectively, shown separately. Spearman rank correlation coefficients with their uncertainty are listed above the panels. In the middle panel, we also present a stellar population evolution model that shows the color and SB evolution of an aging stellar population (see text for details). The stellar population ages corresponding to different colors are shown in red on the left. The blue cross in the middle panel shows the average uncertainties in the parameters. Bottom panel: Cluster-centric distributions of the dwarfs located in the different quadrants of the middle panel.
Current usage metrics show cumulative count of Article Views (full-text article views including HTML views, PDF and ePub downloads, according to the available data) and Abstracts Views on Vision4Press platform.
Data correspond to usage on the plateform after 2015. The current usage metrics is available 48-96 hours after online publication and is updated daily on week days.
Initial download of the metrics may take a while.