Fig. 2.
Download original image
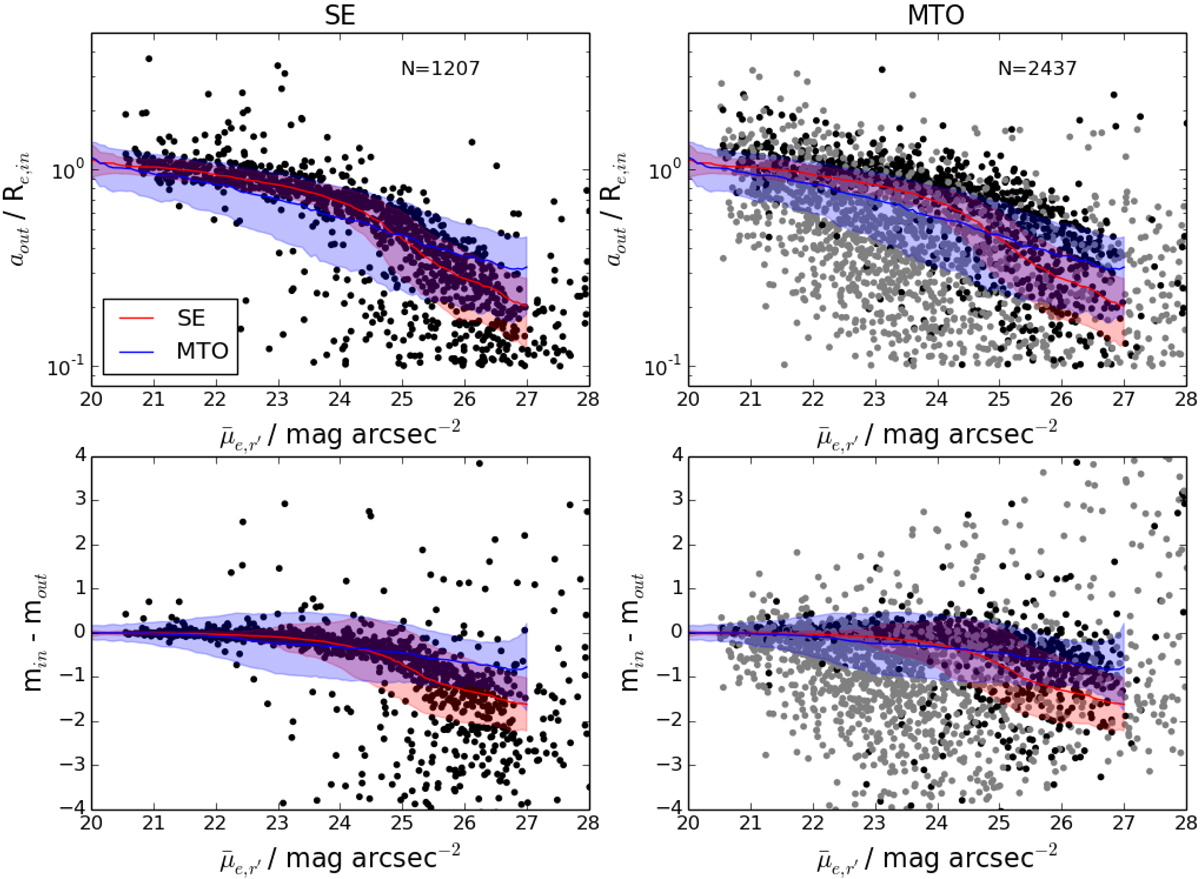
Accuracy of parameters for initial detections. Upper panels: ratio between the measured semimajor axis length and the input effective radii (aout/Re, in) for the mock galaxies as a function of their mean effective SB in the r′ band (![]() ). Lower panels: difference between the input magnitudes (min) and the measured magnitudes (mout). Left and right panels: comparisons when using SE and MTO, respectively. The blue (MTO) and red (SE) lines correspond to the running means of the measurements with a filter size of
). Lower panels: difference between the input magnitudes (min) and the measured magnitudes (mout). Left and right panels: comparisons when using SE and MTO, respectively. The blue (MTO) and red (SE) lines correspond to the running means of the measurements with a filter size of ![]() = 1 mag arcsec−2. Shaded areas around the running means show the median absolute deviation from the means with the corresponding colors. The gray and black symbols in the right panels correspond to the objects that are only detected using MTO and to the objects detected using both methods, respectively.
= 1 mag arcsec−2. Shaded areas around the running means show the median absolute deviation from the means with the corresponding colors. The gray and black symbols in the right panels correspond to the objects that are only detected using MTO and to the objects detected using both methods, respectively.
Current usage metrics show cumulative count of Article Views (full-text article views including HTML views, PDF and ePub downloads, according to the available data) and Abstracts Views on Vision4Press platform.
Data correspond to usage on the plateform after 2015. The current usage metrics is available 48-96 hours after online publication and is updated daily on week days.
Initial download of the metrics may take a while.