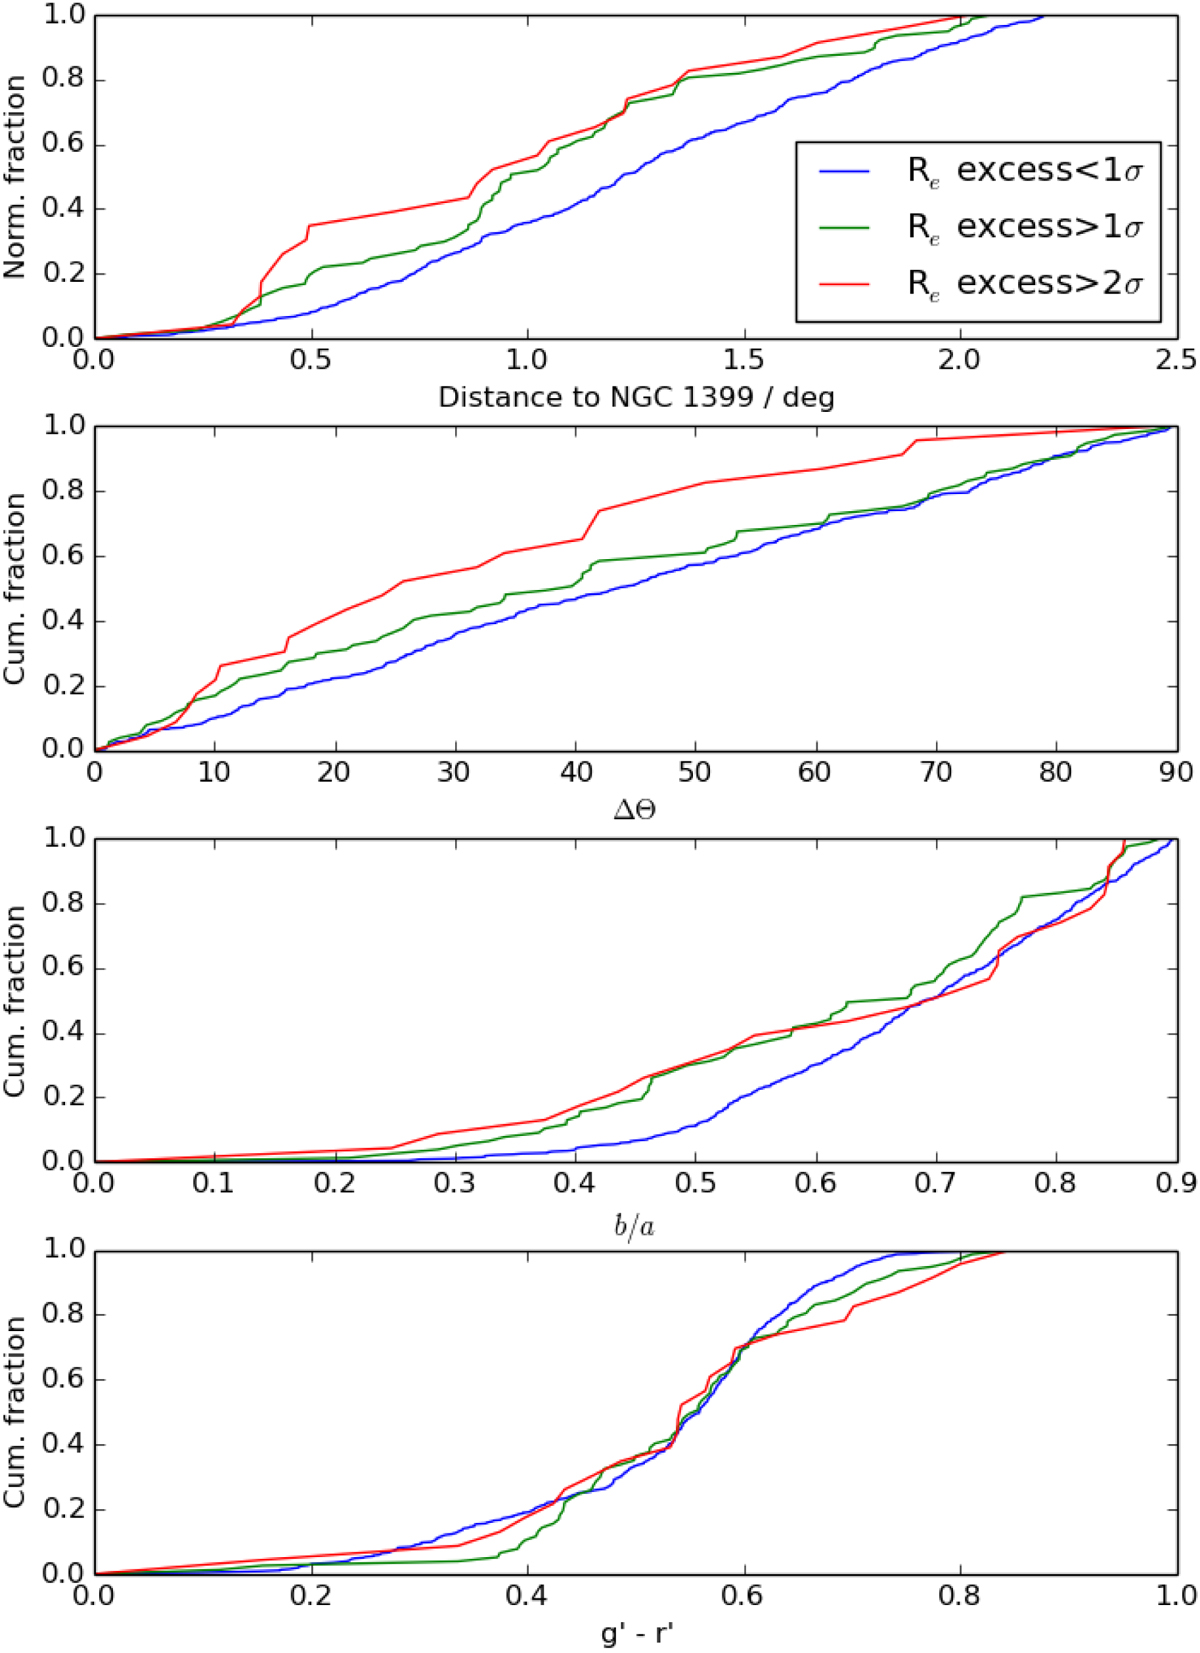
Fig. 19.
Download original image
Distribution of galaxies with large excess size. Cumulative distributions of cluster-centric distance (top panel), cluster-centric orientation (second panel), axis ratio (third panel), and color (bottom panel) for the Fornax cluster dwarfs. The different colors indicate the galaxies with different excess sizes: The blue lines show the galaxies with excess Re < ⟨Re(M*)⟩ + 1σ, the green lines galaxies with Re > ⟨Re(M*)⟩ + 1σ, and the red lines galaxies with Re > ⟨Re(M*)⟩ + 2σ.
Current usage metrics show cumulative count of Article Views (full-text article views including HTML views, PDF and ePub downloads, according to the available data) and Abstracts Views on Vision4Press platform.
Data correspond to usage on the plateform after 2015. The current usage metrics is available 48-96 hours after online publication and is updated daily on week days.
Initial download of the metrics may take a while.