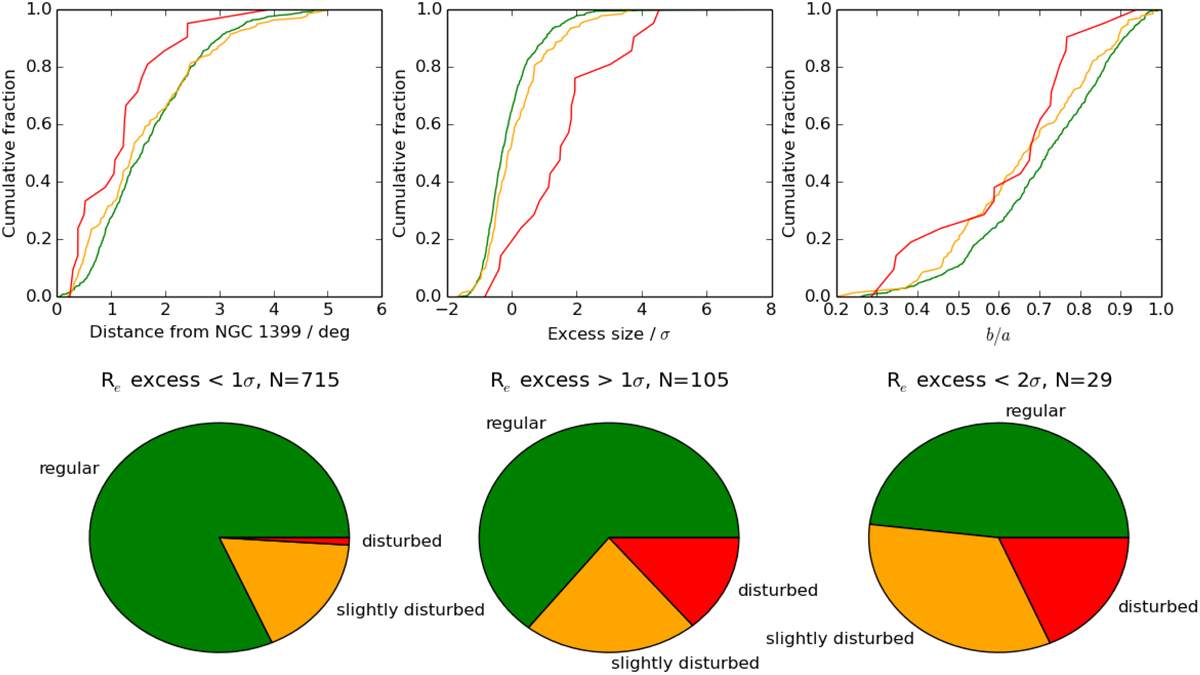
Fig. 18.
Download original image
Distribution of tidal morphologies. Upper panels: cumulative distributions of cluster-centric distance (left panel), excess size (middle panel), and axis ratios (right panel) for the galaxies with different tidal morphologies. The colors of the curves in the panels correspond to the morphological classes named in the bottom panel pie charts and indicated with the same colors. Bottom panels: pie charts showing the fractions of the tidal morphological classes among galaxies that deviate by less than 1σ from the mass normalized Re distribution mean (left), galaxies that deviate by more than 1σ (middle), and galaxies that deviate by more than 2σ (right).
Current usage metrics show cumulative count of Article Views (full-text article views including HTML views, PDF and ePub downloads, according to the available data) and Abstracts Views on Vision4Press platform.
Data correspond to usage on the plateform after 2015. The current usage metrics is available 48-96 hours after online publication and is updated daily on week days.
Initial download of the metrics may take a while.