Fig. 17.
Download original image
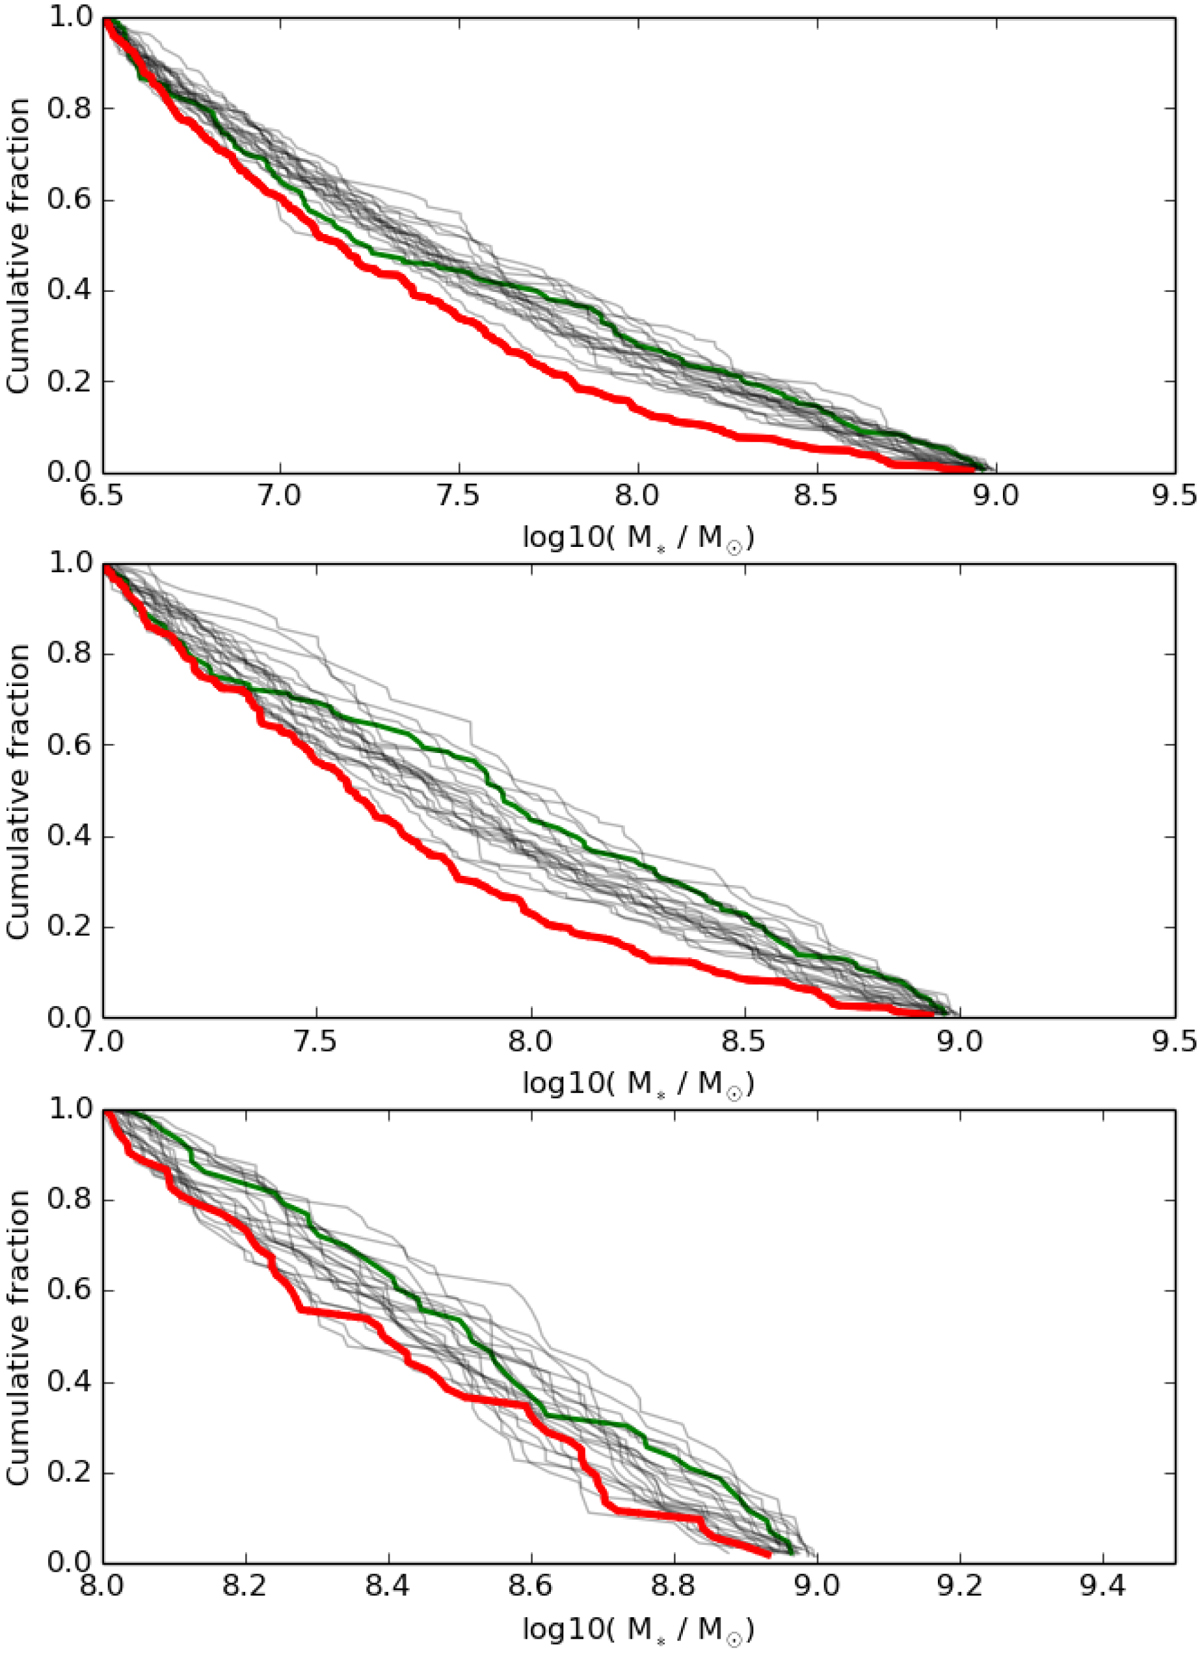
Cumulative stellar-mass functions for the Fornax cluster (red lines) and IllustrisTNG Fornax-like groups (gray lines). The IllustrisTNG group most similar to Fornax is shown with the green lines. The different panels show the comparisons using different stellar-mass ranges: The upper panel shows galaxies with 6.5 < log(M*/M⊙) < 9, the middle panel shows galaxies between 7 < log(M*/M⊙) < 9, and the bottom panel shows galaxies with 8 < log(M*/M⊙) < 9.
Current usage metrics show cumulative count of Article Views (full-text article views including HTML views, PDF and ePub downloads, according to the available data) and Abstracts Views on Vision4Press platform.
Data correspond to usage on the plateform after 2015. The current usage metrics is available 48-96 hours after online publication and is updated daily on week days.
Initial download of the metrics may take a while.