Fig. 15.
Download original image
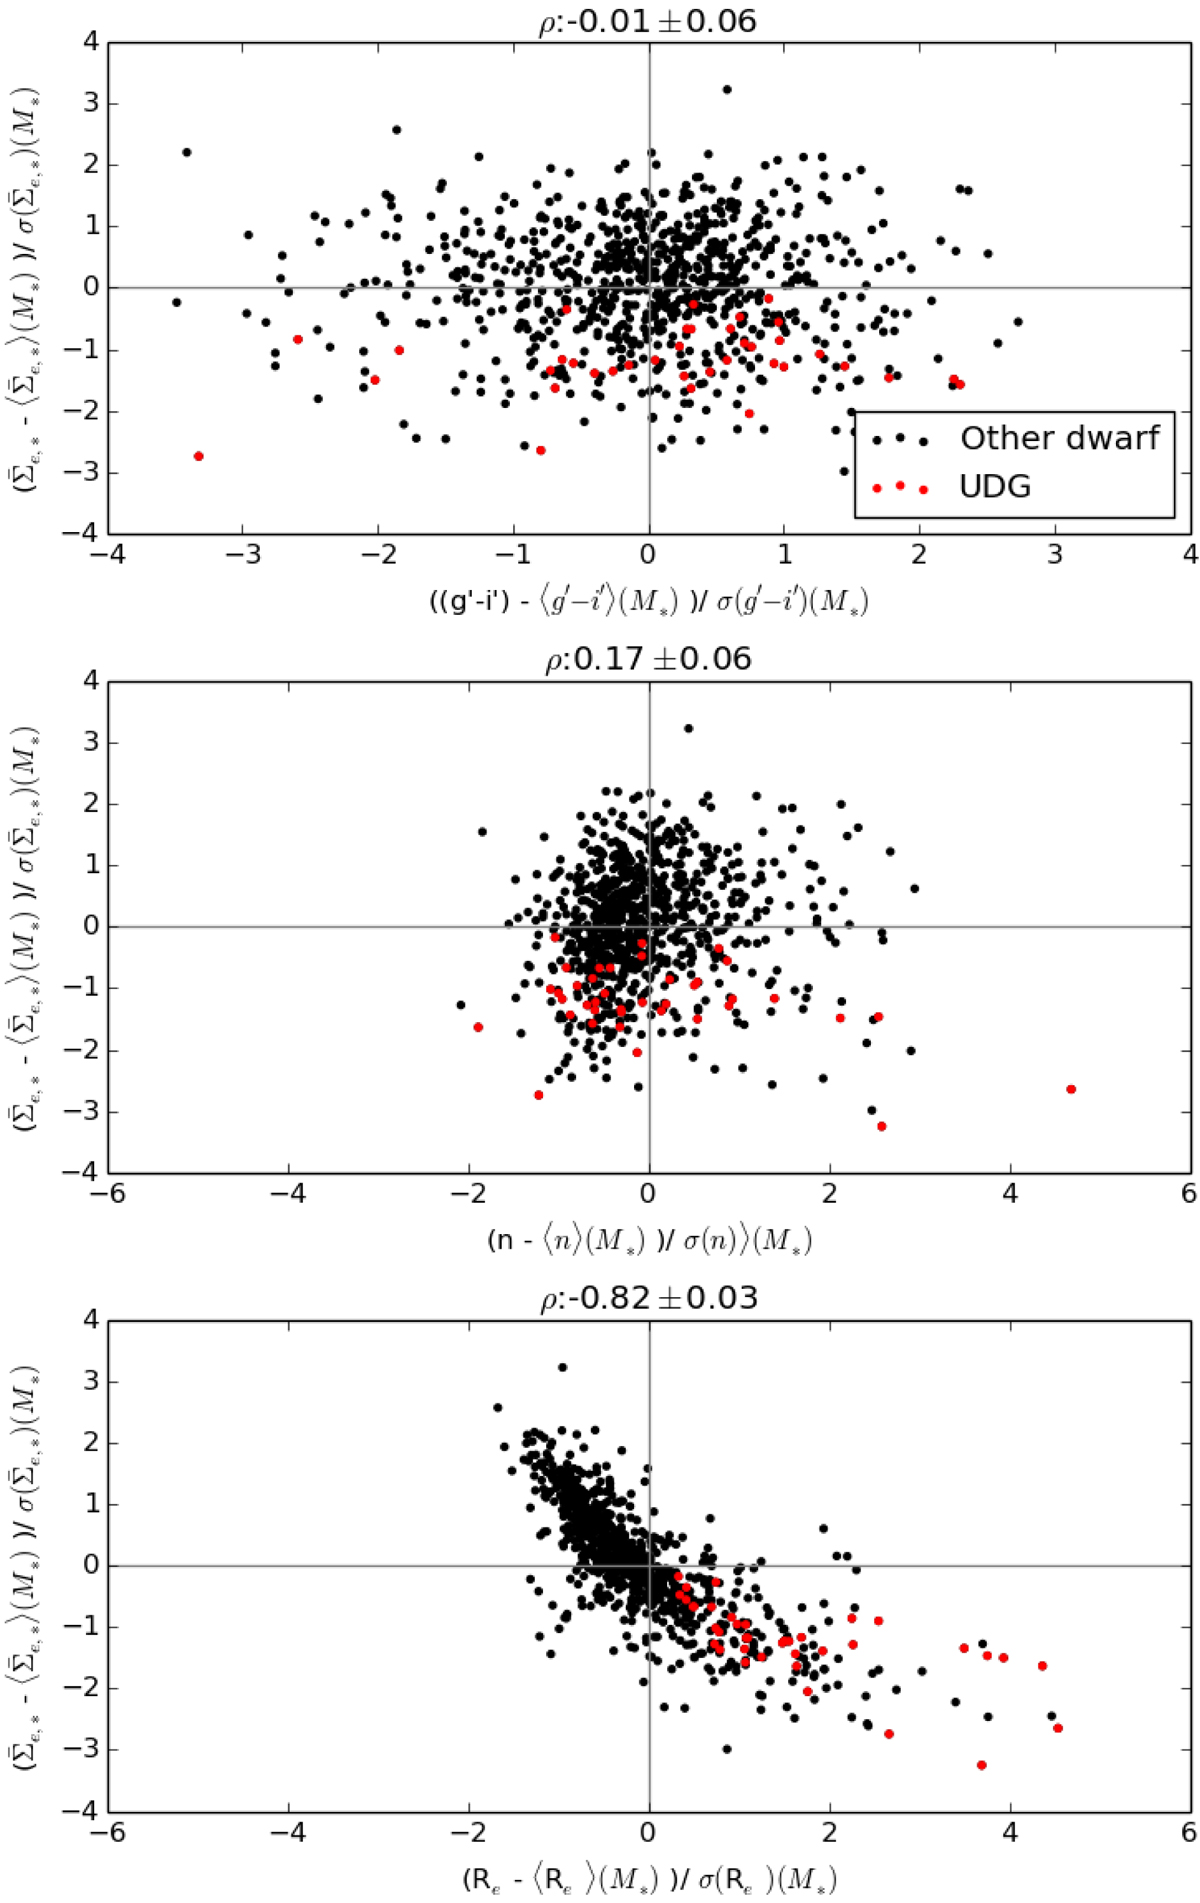
Correlations between the excess mean effective stellar SD and properties of the FDS dwarfs. Upper panel: comparison with the excess color (with respect to the mean at a given mass), the middle panel with the excess Sérsic index, and the lower panel with the excess effective radius. The red symbols highlight the UDGs, and the black symbols show the other dwarfs.
Current usage metrics show cumulative count of Article Views (full-text article views including HTML views, PDF and ePub downloads, according to the available data) and Abstracts Views on Vision4Press platform.
Data correspond to usage on the plateform after 2015. The current usage metrics is available 48-96 hours after online publication and is updated daily on week days.
Initial download of the metrics may take a while.