Fig. 14.
Download original image
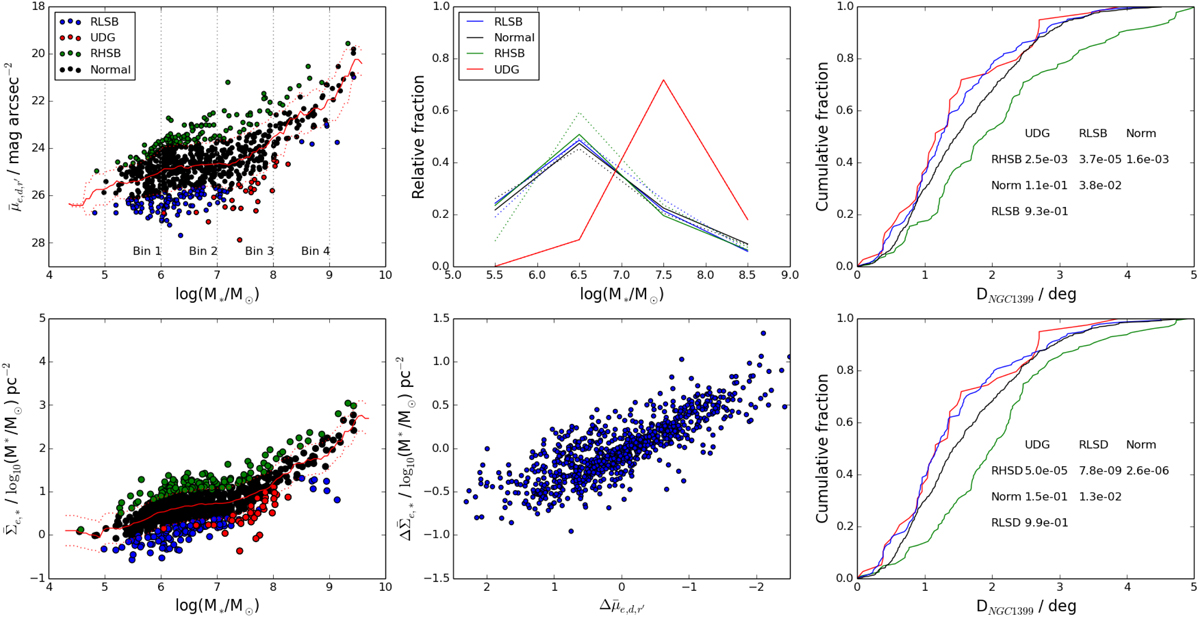
Cluster-centric trends in galaxies’ relative surface brightness and density. Upper-left and lower-left panels: de-projected mean effective SB (![]() ) and stellar SD (
) and stellar SD (![]() ) as a function of galaxy stellar mass (M*) for the Fornax cluster dwarfs, respectively. The solid and dashed red lines show the running mean and standard deviations from that, respectively. The RHSB galaxies, RLSB galaxies, normal galaxies, and UDGs are indicated with the different colors, shown in the legend in the upper-left panel. The definitions of those classes are described in the text. Upper-middle panel: normalized mass distributions of the different SB subsamples in the mass bins indicated with the vertical lines in the upper-left panel. Lower-middle panel: correlation between
) as a function of galaxy stellar mass (M*) for the Fornax cluster dwarfs, respectively. The solid and dashed red lines show the running mean and standard deviations from that, respectively. The RHSB galaxies, RLSB galaxies, normal galaxies, and UDGs are indicated with the different colors, shown in the legend in the upper-left panel. The definitions of those classes are described in the text. Upper-middle panel: normalized mass distributions of the different SB subsamples in the mass bins indicated with the vertical lines in the upper-left panel. Lower-middle panel: correlation between ![]() and
and ![]() . Right panels: cumulative cluster-centric distance distribution for the different subsamples when defined using
. Right panels: cumulative cluster-centric distance distribution for the different subsamples when defined using ![]() (upper-right panel) and
(upper-right panel) and ![]() (lower-right panel). K-S test p values for the assumption of two samples being drawn from the same distribution are also listed for all the sample pairs in the lower right of the right panels.
(lower-right panel). K-S test p values for the assumption of two samples being drawn from the same distribution are also listed for all the sample pairs in the lower right of the right panels.
Current usage metrics show cumulative count of Article Views (full-text article views including HTML views, PDF and ePub downloads, according to the available data) and Abstracts Views on Vision4Press platform.
Data correspond to usage on the plateform after 2015. The current usage metrics is available 48-96 hours after online publication and is updated daily on week days.
Initial download of the metrics may take a while.