Fig. 13.
Download original image
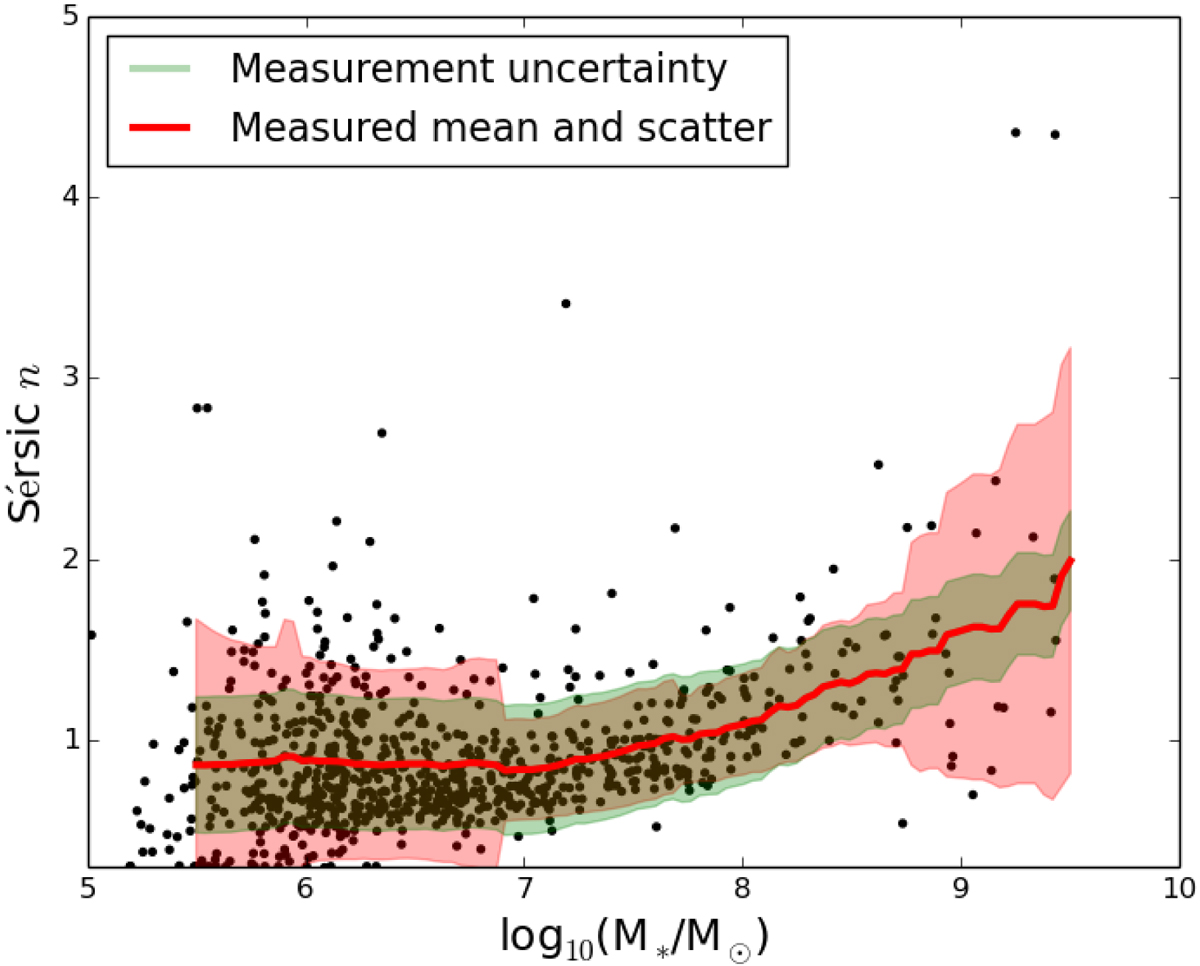
Sérsic indices as a function of galaxy stellar mass. The black points show the measurements for the dwarf galaxies in the Fornax cluster, and the red line shows the running average with a filter size of 0.5 dex. The green and red shaded areas correspond to the scatter expected from the measurement uncertainties and the measured scatter, respectively.
Current usage metrics show cumulative count of Article Views (full-text article views including HTML views, PDF and ePub downloads, according to the available data) and Abstracts Views on Vision4Press platform.
Data correspond to usage on the plateform after 2015. The current usage metrics is available 48-96 hours after online publication and is updated daily on week days.
Initial download of the metrics may take a while.