Fig. 11.
Download original image
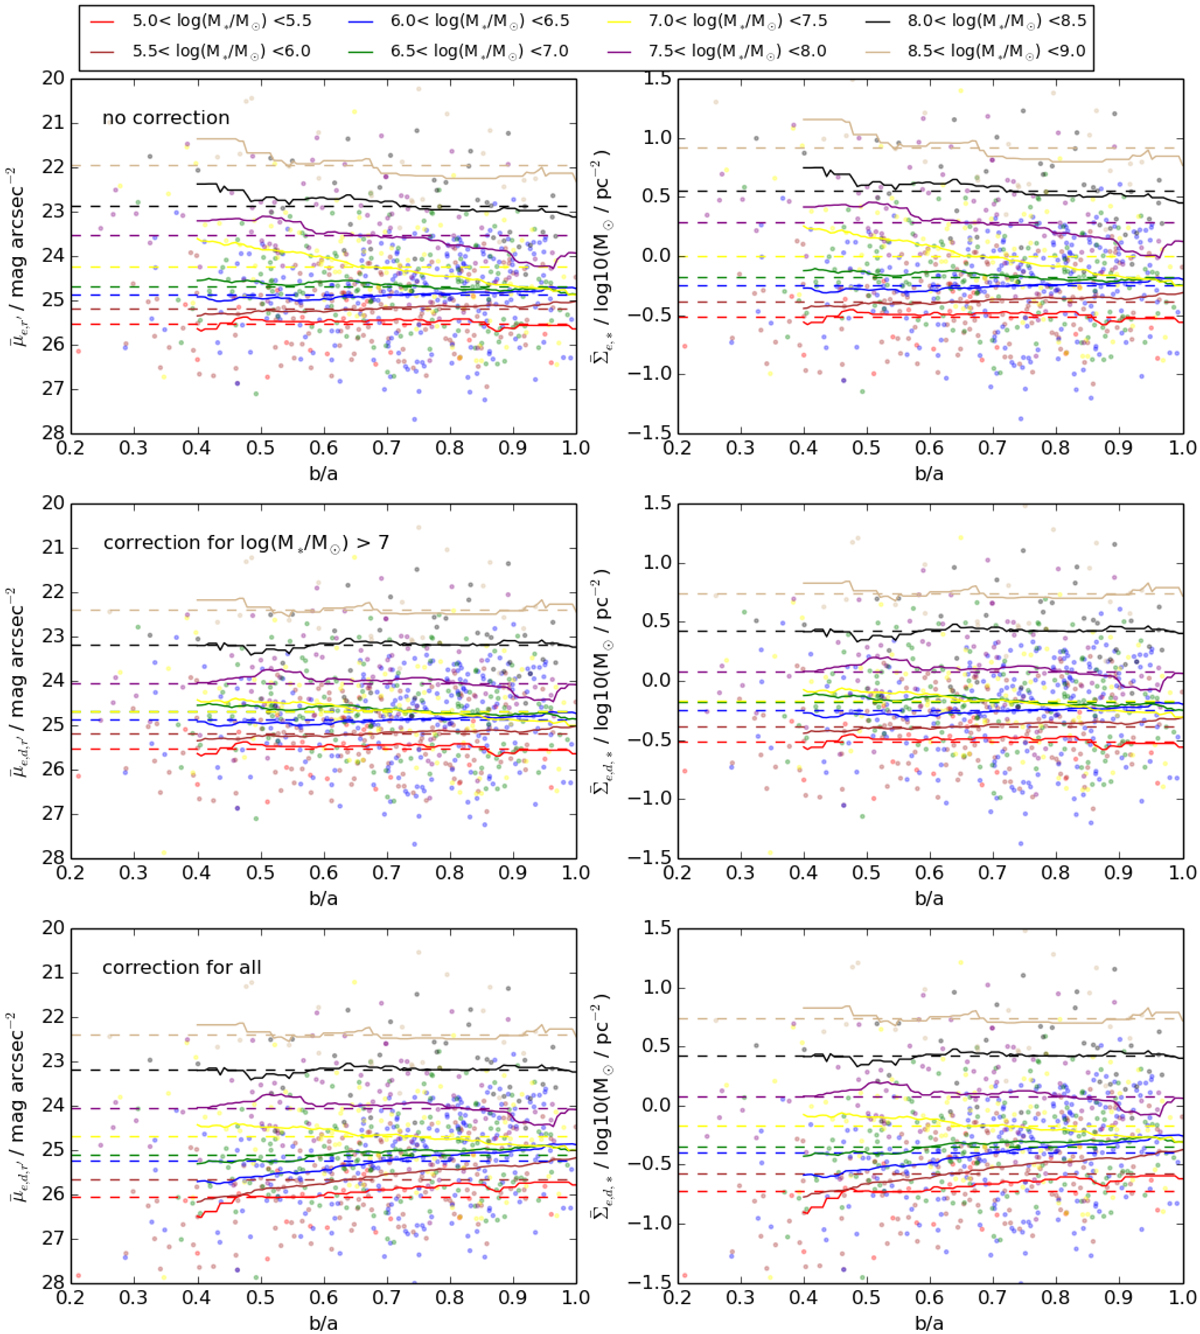
Inclination corrections. Correlation between the axis ratio (b/a), mean effective SB (![]() ), and stellar SD (
), and stellar SD (![]() ) of the galaxies. Upper panels: values without any inclination corrections, in the middle panels galaxies with log(M*/M⊙) > 7 have been corrected for their inclination, and in the bottom panels inclination correction has been applied to all the galaxies. The different colors correspond to different mass bins, as shown in the legend. The solid and dashed lines indicate the running mean (filter size of 0.2) and the mean of the mass bin.
) of the galaxies. Upper panels: values without any inclination corrections, in the middle panels galaxies with log(M*/M⊙) > 7 have been corrected for their inclination, and in the bottom panels inclination correction has been applied to all the galaxies. The different colors correspond to different mass bins, as shown in the legend. The solid and dashed lines indicate the running mean (filter size of 0.2) and the mean of the mass bin.
Current usage metrics show cumulative count of Article Views (full-text article views including HTML views, PDF and ePub downloads, according to the available data) and Abstracts Views on Vision4Press platform.
Data correspond to usage on the plateform after 2015. The current usage metrics is available 48-96 hours after online publication and is updated daily on week days.
Initial download of the metrics may take a while.