Fig. 10.
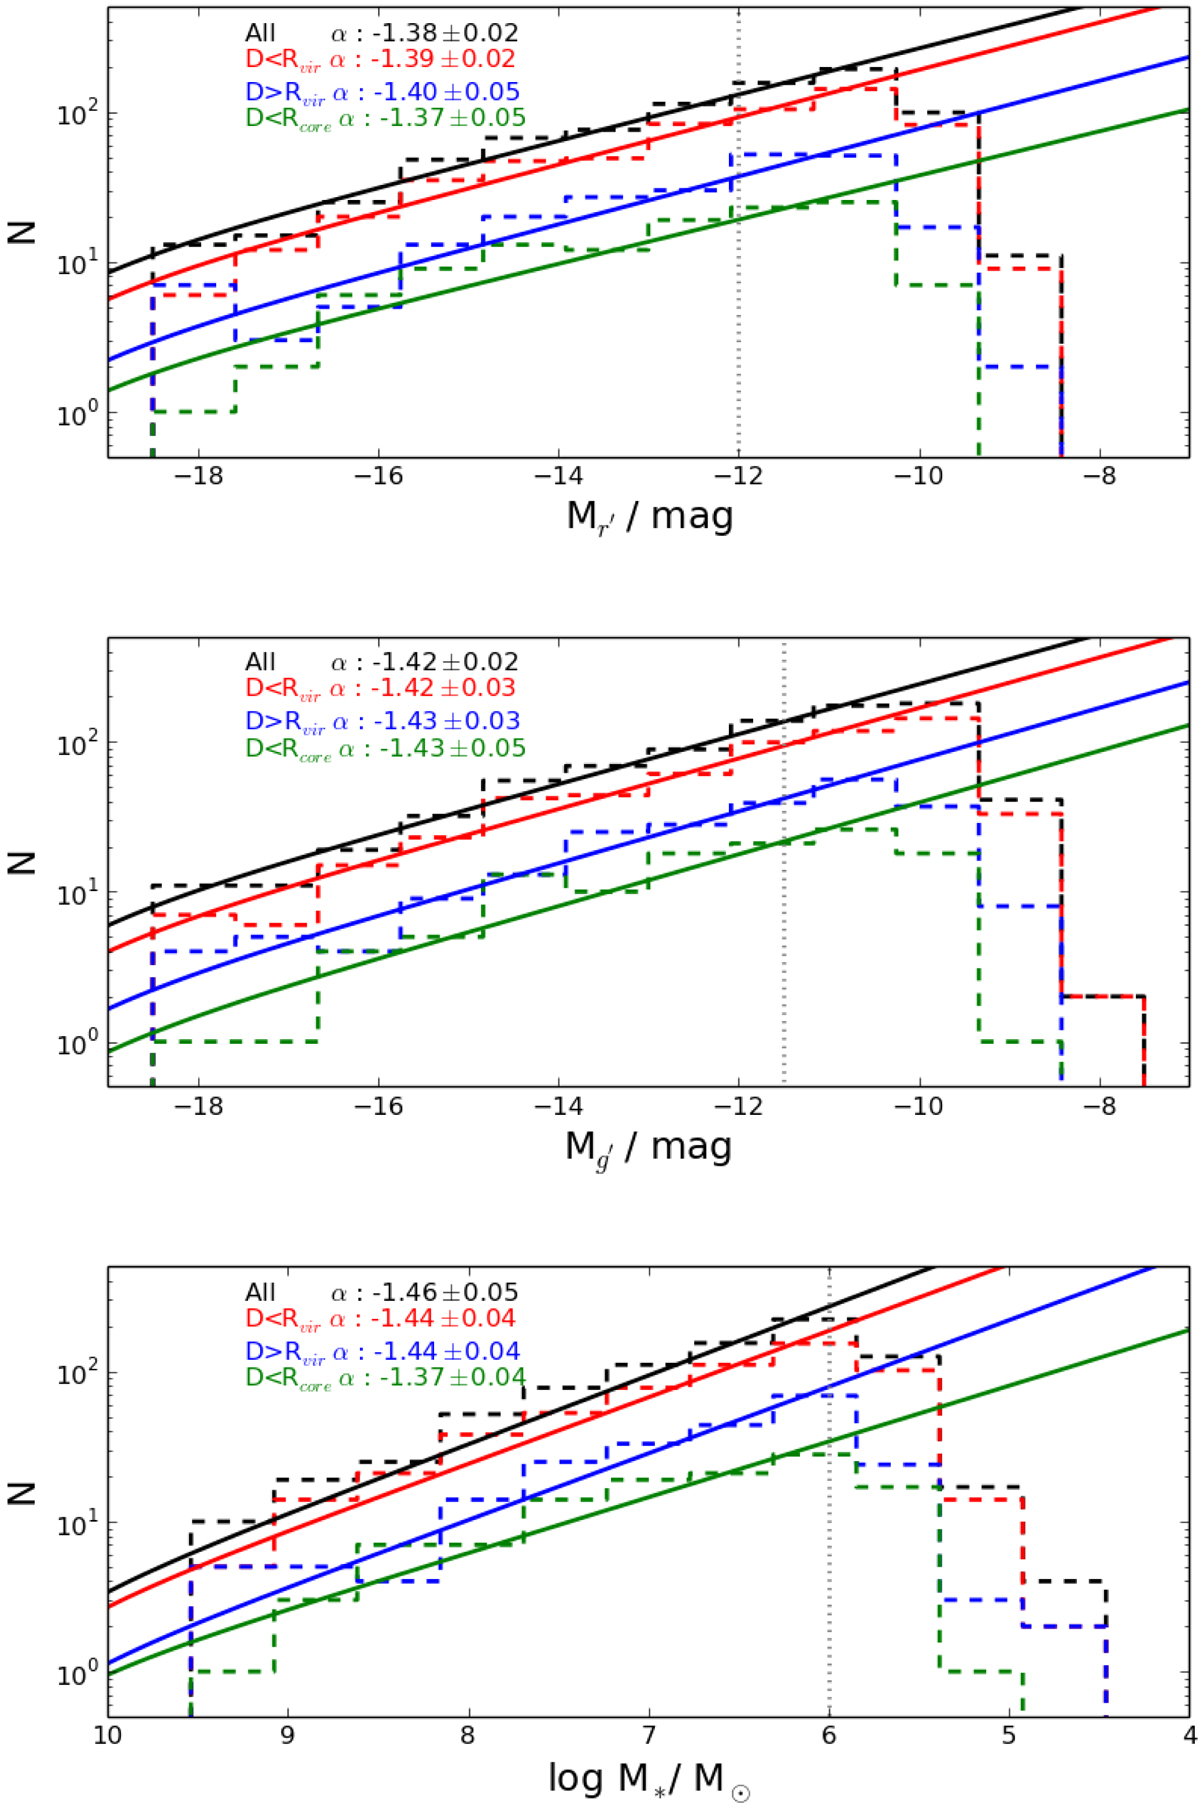
Download original image
Galaxy luminosity and mass functions. Upper and middle panels: r′- and g′-band LFs of the Fornax cluster dwarf galaxies, respectively. Bottom panel: stellar mass function. The black, red, blue, and green histograms show the LF for all the galaxies, for galaxies within the virial radius of the Fornax cluster, those outside of it, and those within the cluster core, respectively. The curves show the Schechter function fits to the data, and the fit parameters are shown with corresponding colors in the upper-left corner of the image. The dotted gray lines show the completeness limits for the different parameters.
Current usage metrics show cumulative count of Article Views (full-text article views including HTML views, PDF and ePub downloads, according to the available data) and Abstracts Views on Vision4Press platform.
Data correspond to usage on the plateform after 2015. The current usage metrics is available 48-96 hours after online publication and is updated daily on week days.
Initial download of the metrics may take a while.