Fig. 1.
Download original image
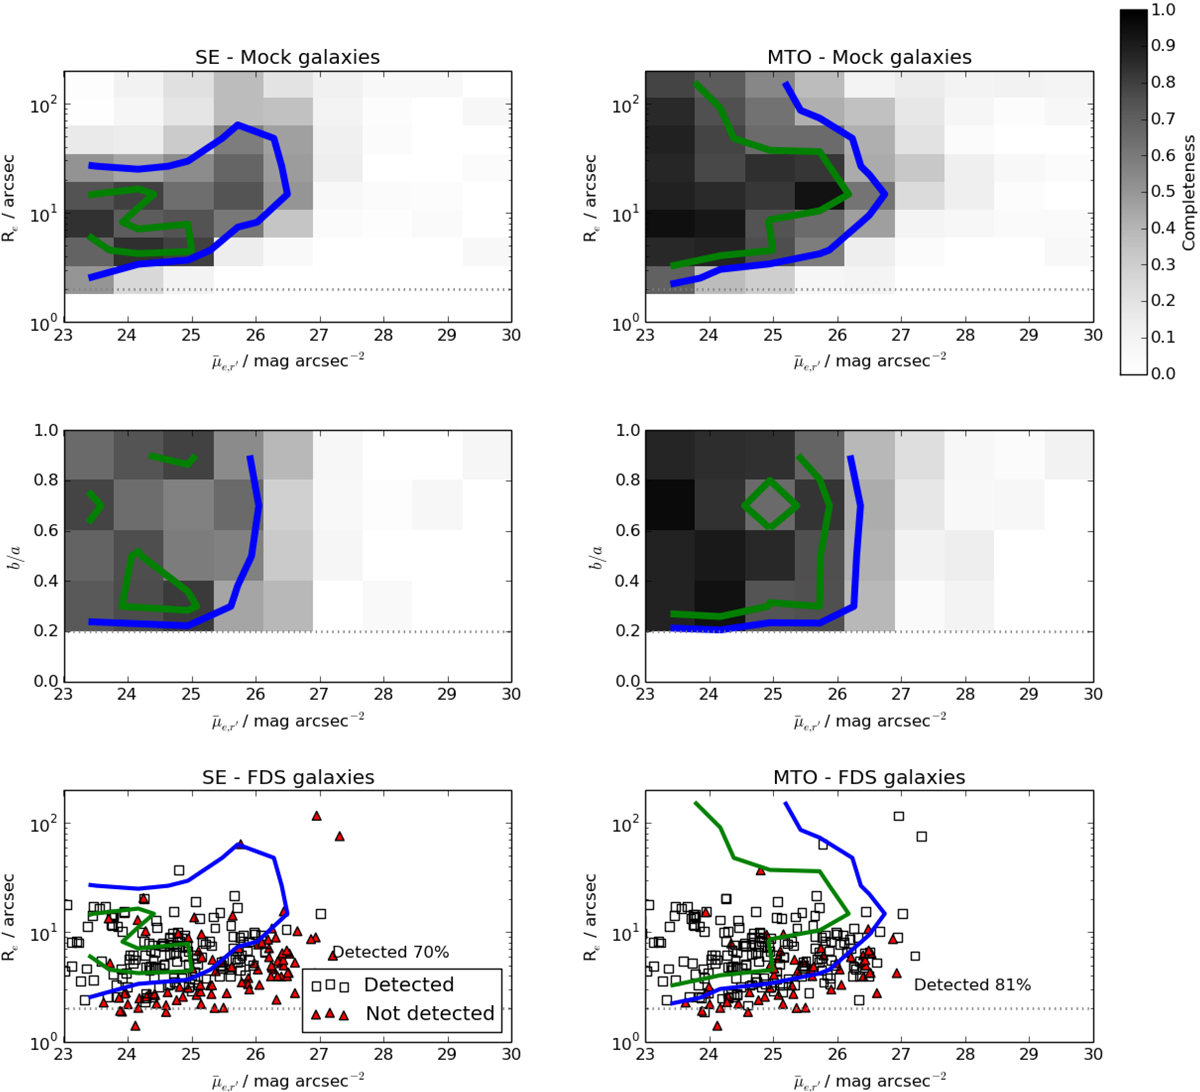
Results of detection completeness tests. Detection completeness of SE (left panels) and MTO (right panels) as a function of the input r′-band mean effective SB (![]() ), effective radius (Re), and axis ratio (b/a). Upper and middle panels: results for the artificial images and the lower panels for the known core LSB catalog galaxies (Venhola et al. 2017). The gray scales in the upper and middle panels correspond to the completeness indicated by the color bar. The green and blue contours show the 75% and 50% completeness limits, respectively. Those same lines are also shown in the lower panels. In the lower panels, squares show the detected galaxies and red triangles show the non-detections.
), effective radius (Re), and axis ratio (b/a). Upper and middle panels: results for the artificial images and the lower panels for the known core LSB catalog galaxies (Venhola et al. 2017). The gray scales in the upper and middle panels correspond to the completeness indicated by the color bar. The green and blue contours show the 75% and 50% completeness limits, respectively. Those same lines are also shown in the lower panels. In the lower panels, squares show the detected galaxies and red triangles show the non-detections.
Current usage metrics show cumulative count of Article Views (full-text article views including HTML views, PDF and ePub downloads, according to the available data) and Abstracts Views on Vision4Press platform.
Data correspond to usage on the plateform after 2015. The current usage metrics is available 48-96 hours after online publication and is updated daily on week days.
Initial download of the metrics may take a while.