Fig. 6
Download original image
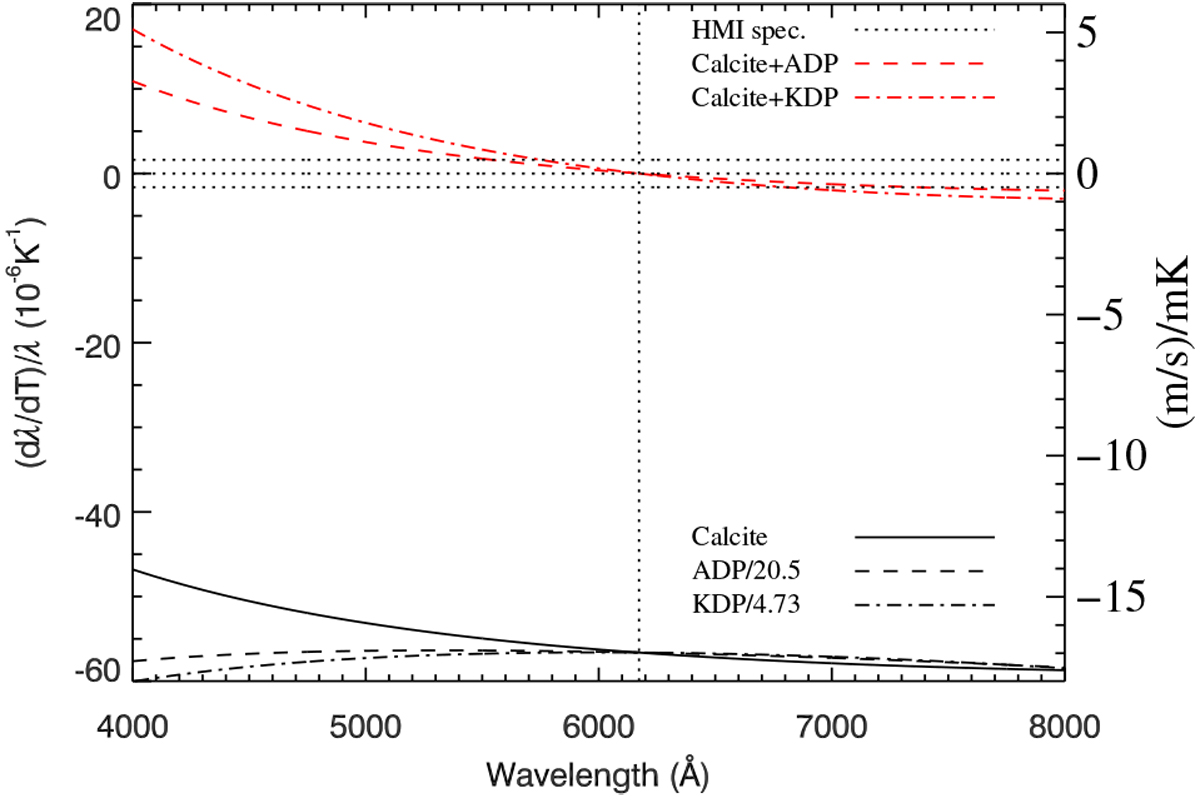
Wavelength dependence of the temperature dependence. The solid black line shows the temperature dependence of calcite. Dashed and dash-dotted black lines show ADP and KDP, scaled to having the same value as calcite at 6173 Å. The top red lines show the results for calcite+ADP and calcite+KDP, optimized for 6173 Å. The dotted lines show the HMI specification. The calcite numbers are from Eq. (10) of Title et al. (1976). The ADP and KDP numbers are derived from the 201 and 300 K numbers in Table 1 of Ghosh & Bhar (1982) and temperature expansion coefficients of 4.2 × 10⁻⁶ and 44 × 10−6 for ADP and KDP, respectively (Couvidat et al. 2012).
Current usage metrics show cumulative count of Article Views (full-text article views including HTML views, PDF and ePub downloads, according to the available data) and Abstracts Views on Vision4Press platform.
Data correspond to usage on the plateform after 2015. The current usage metrics is available 48-96 hours after online publication and is updated daily on week days.
Initial download of the metrics may take a while.