Fig. 4
Download original image
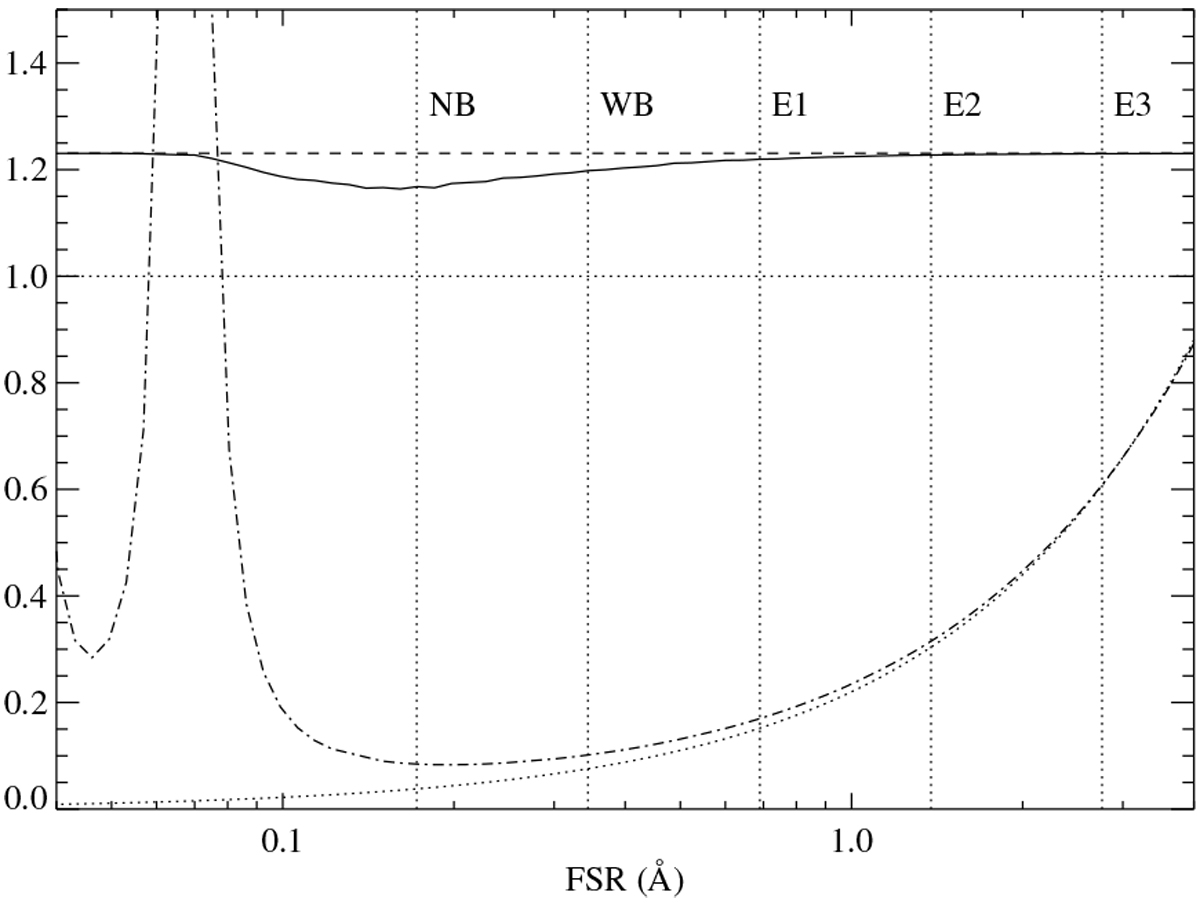
Noise as a function of the FSR of the inserted element for a spectrograph with a resolution of roughly R = 90000. Performance is shown relative to that of an ideal spectrograph with infinite resolution. The dotted line at 1.0 is shown for reference. The dashed line shows the performance of the spectrograph without the element. The solid line shows the performance with the element inserted. The dash-dotted line shows the noise on the calibration signal. The bottom dotted line is proportional to the FSR, showing that the asymptotic behavior for high FSR is as expected. The vertical dotted lines show the FSRs of the HMI Michelsons (NB and WB) and the narrowest three Lyot elements (E1 through E3). For simplicity, the PSF, here and in the rest of the paper, is taken to be a boxcar, with R being the ratio of the wavelength to the width of the boxcar.
Current usage metrics show cumulative count of Article Views (full-text article views including HTML views, PDF and ePub downloads, according to the available data) and Abstracts Views on Vision4Press platform.
Data correspond to usage on the plateform after 2015. The current usage metrics is available 48-96 hours after online publication and is updated daily on week days.
Initial download of the metrics may take a while.