Fig. 3
Download original image
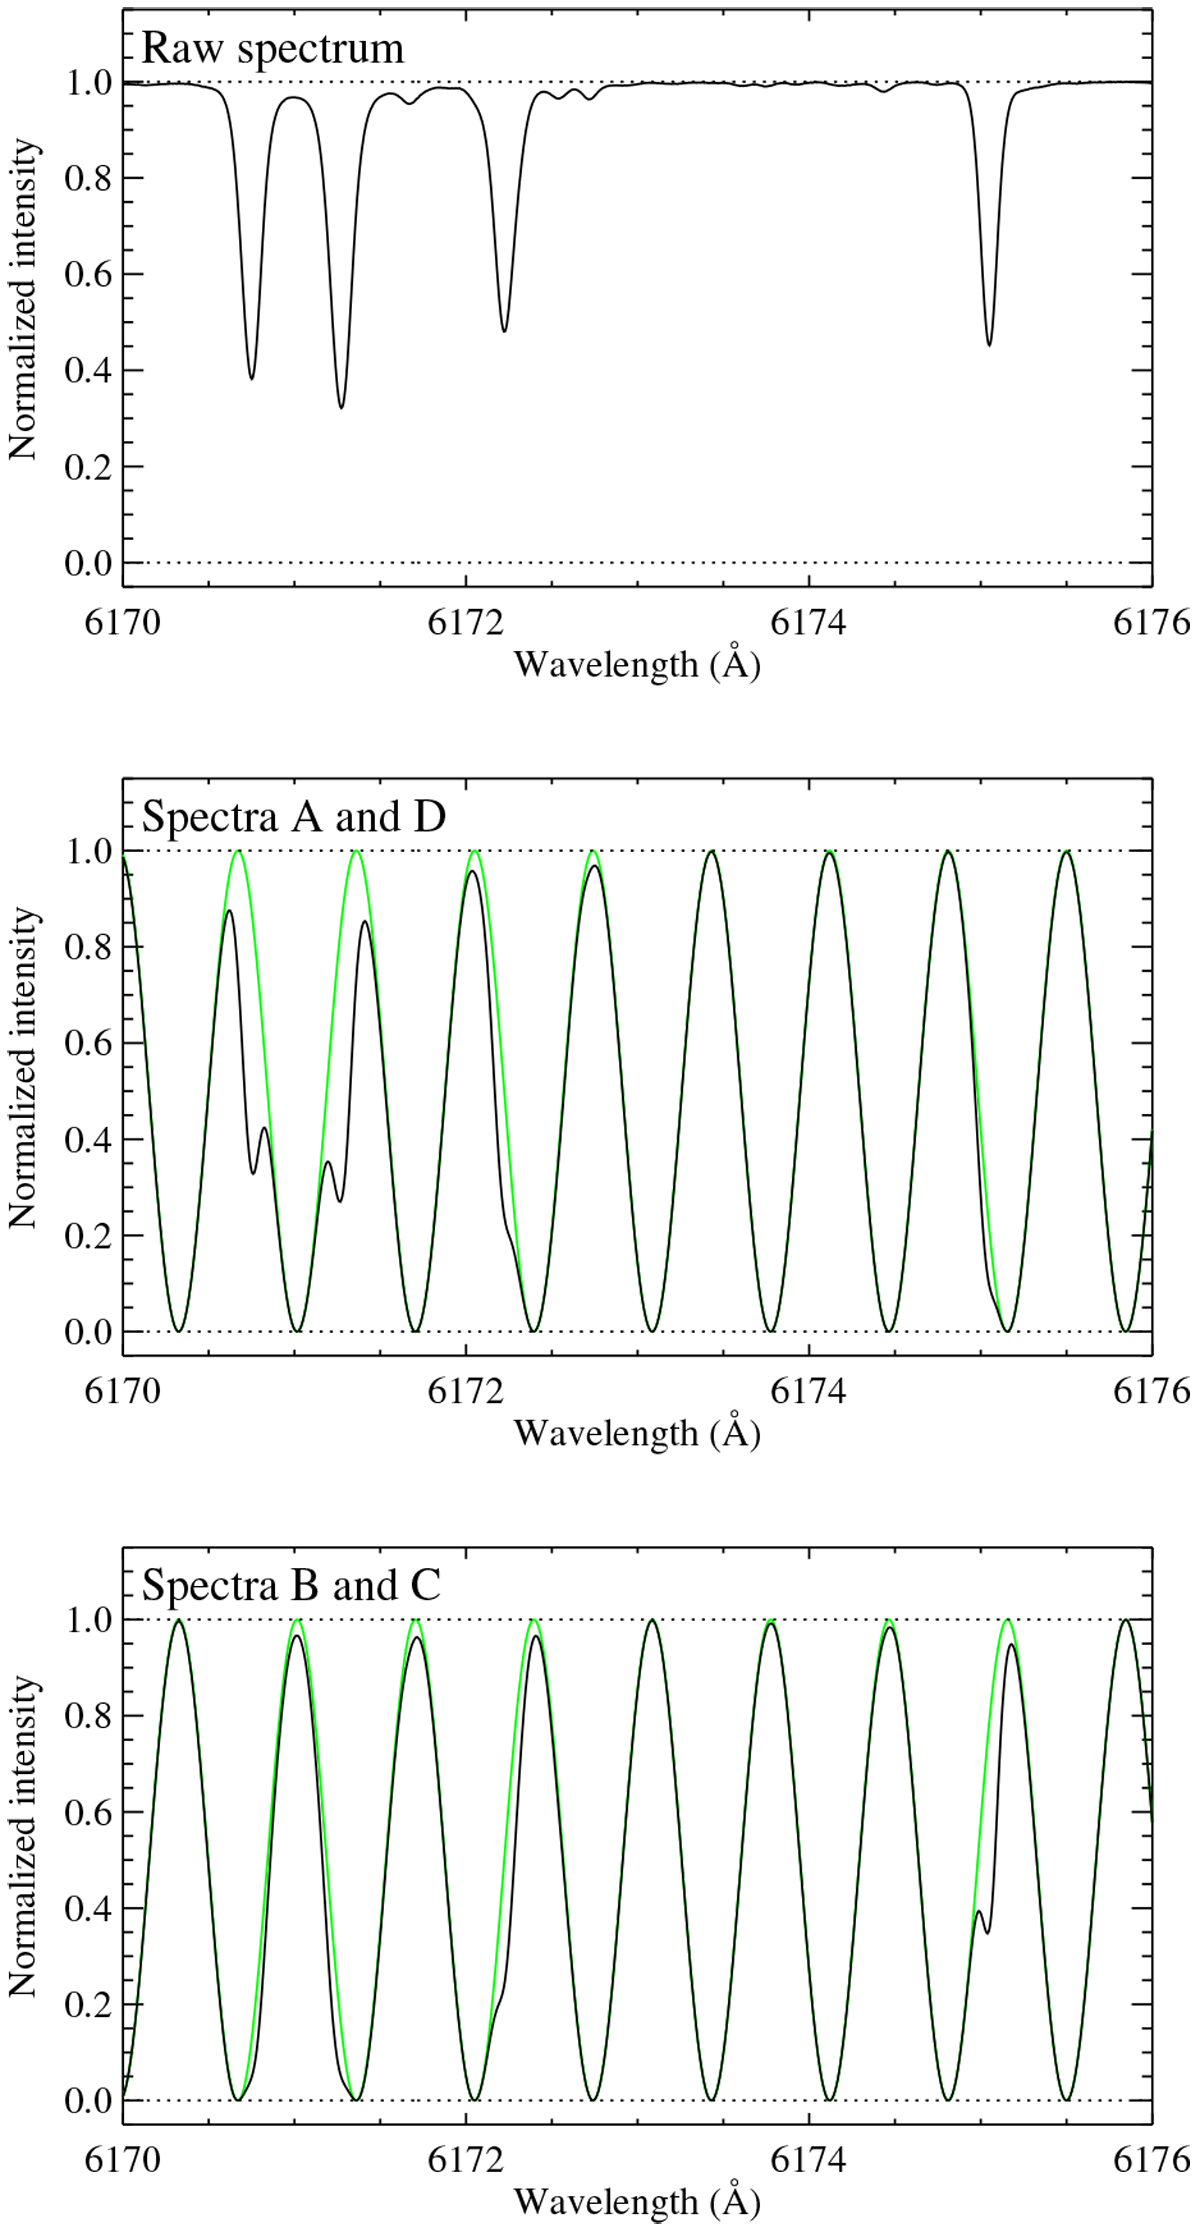
Examples of spectra. Top panel: small section of a high-resolution FTS spectrum of the Sun observed by Reiners et al. (2016). Middle panel: result of multiplying the raw spectrum with Eq. (1) (green line) with values of λ0 corresponding to A and D in Fig. 1. Bottom panel: same, but with λ0 corresponding to B and C. The FSR of the HMI E1 element and a contrast B = 100% were used. The Fel line around 6175 Å is the one used by HMI.
Current usage metrics show cumulative count of Article Views (full-text article views including HTML views, PDF and ePub downloads, according to the available data) and Abstracts Views on Vision4Press platform.
Data correspond to usage on the plateform after 2015. The current usage metrics is available 48-96 hours after online publication and is updated daily on week days.
Initial download of the metrics may take a while.