Fig. 4
Download original image
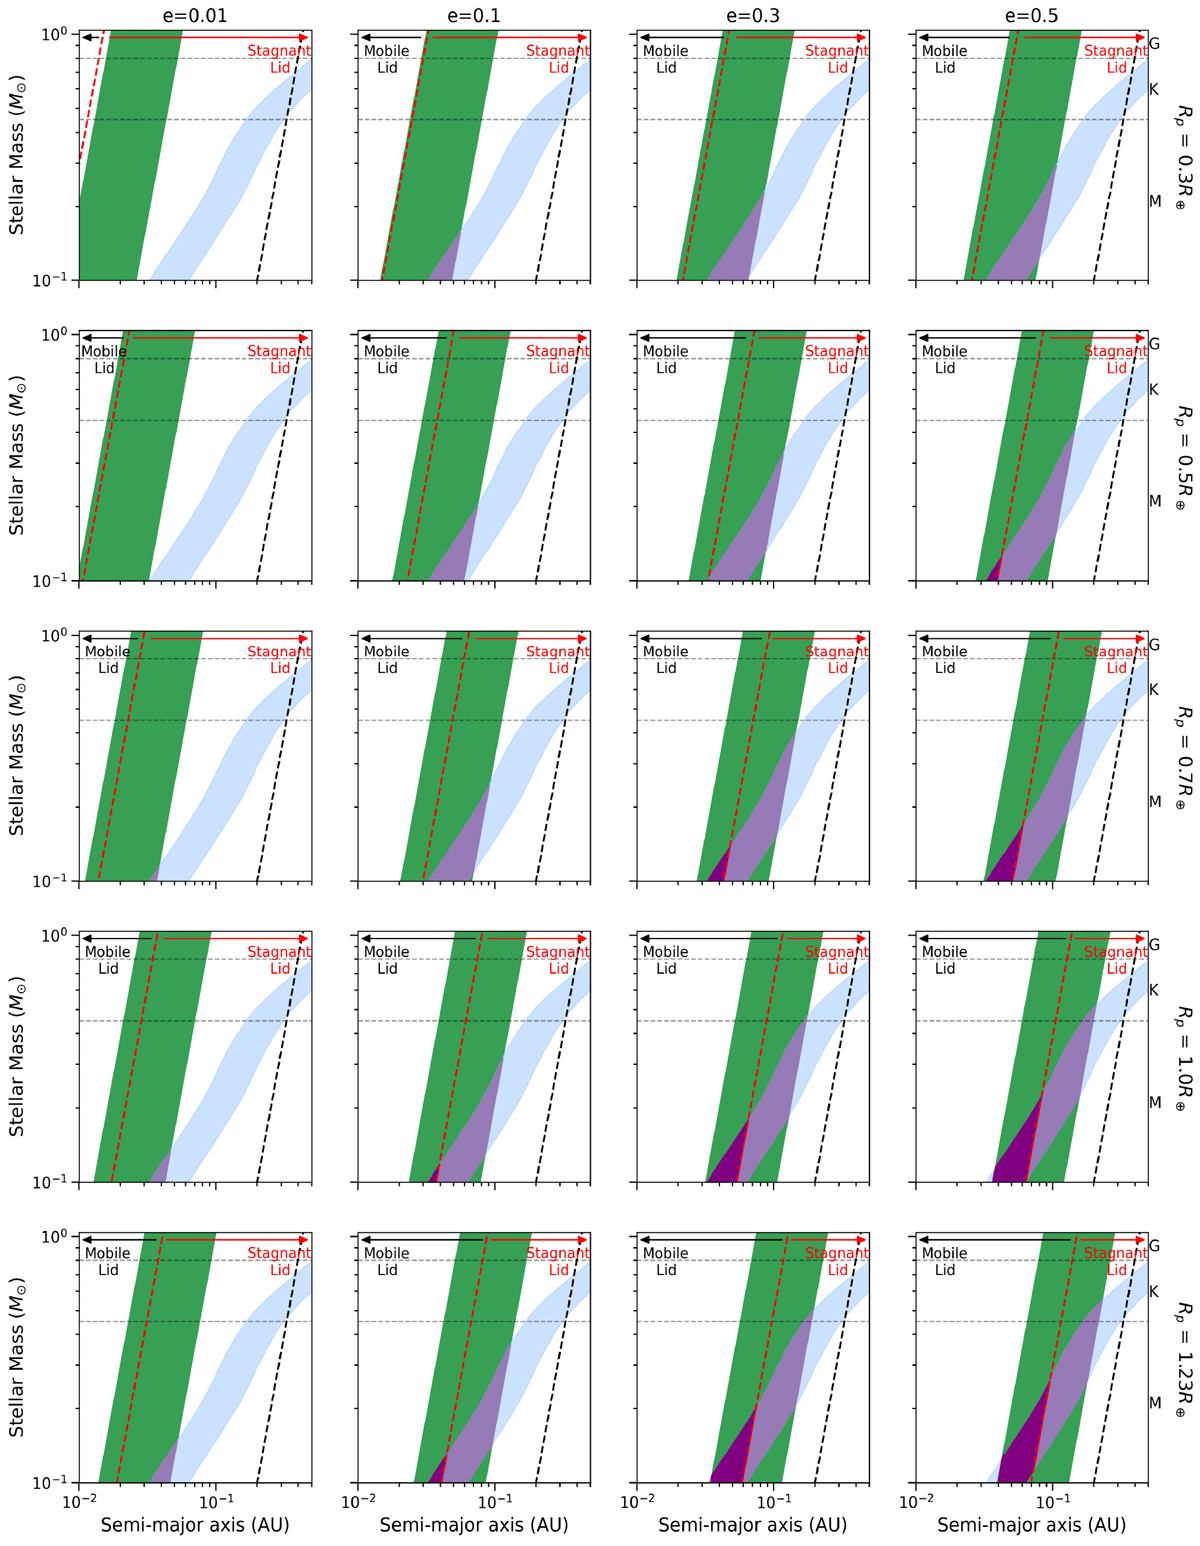
Modelled optimal tidal heating zones (green shaded regions) and tidal stress threshold (red dashed lines) against the CHZ (blue shaded regions), adjusting for parameters of planetary radius, eccentricity, semi-major axis, and stellar mass. Light purple regions represent the area of overlap between tidal heating zones and the CHZ. Dark purple shaded regions represent the area of overlap between tidal stress, tidal heating, and the CHZ. Black dashed lines represent the tidal locking radius from Barnes (2017) Constant-Time-Lag model.
Current usage metrics show cumulative count of Article Views (full-text article views including HTML views, PDF and ePub downloads, according to the available data) and Abstracts Views on Vision4Press platform.
Data correspond to usage on the plateform after 2015. The current usage metrics is available 48-96 hours after online publication and is updated daily on week days.
Initial download of the metrics may take a while.