Fig. 2
Download original image
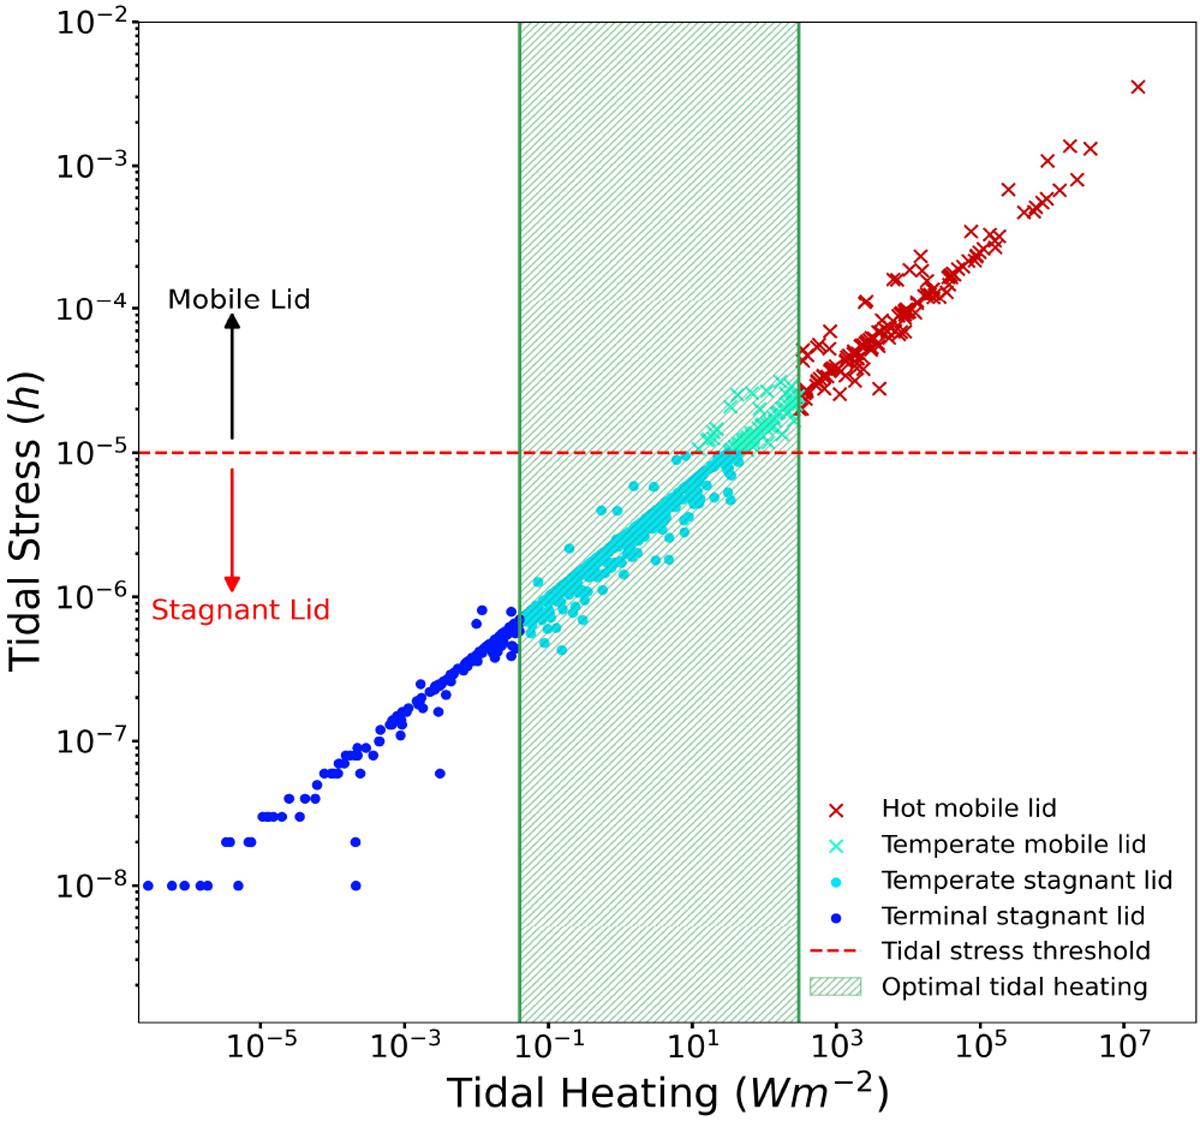
Tidal heating rates and tidal stress values for the 767 exoplanets in our sample. The horizontal dashed red line indicates the threshold when rocky exoplanets experience sufficient tidal stress (h > 10-5) to aid or initiate subduction. The vertical green shaded region denotes the optimal tidal heating regime between 0.04 and 300 Wm-2.
Current usage metrics show cumulative count of Article Views (full-text article views including HTML views, PDF and ePub downloads, according to the available data) and Abstracts Views on Vision4Press platform.
Data correspond to usage on the plateform after 2015. The current usage metrics is available 48-96 hours after online publication and is updated daily on week days.
Initial download of the metrics may take a while.