Fig. 4
Download original image
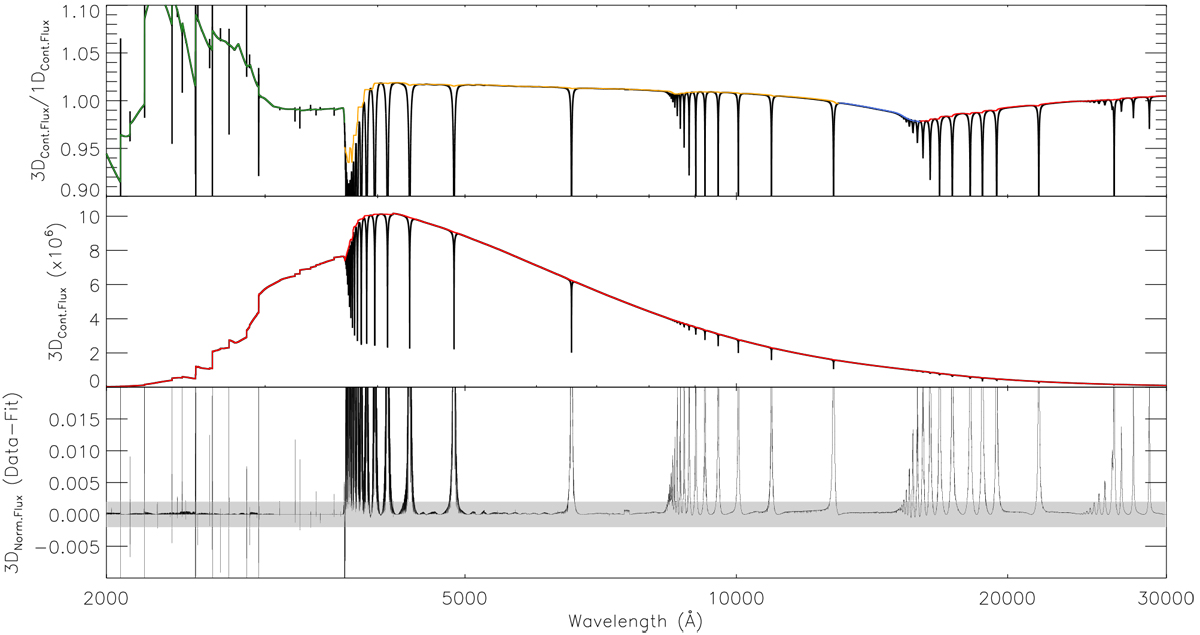
3D continuum correction of the model with stellar parameters Teff = 5865 K, log g = 4.5, and [Fe/H] = 0.0 dex. Upper panel: fit to the upper envelope of the quotient between the 3D and 1D continuums. The different wavelength ranges used for the fit are plotted in different colors. Middle panel: original 3D continuum, shown in black, while the new continuum fitted is depicted in red. Bottom panel: difference between the 3D spectrum normalized with the original continuum, and the 3D spectrum normalized with the new fitted continuum. The shaded area corresponds to the ±0.2% of the normalized flux.
Current usage metrics show cumulative count of Article Views (full-text article views including HTML views, PDF and ePub downloads, according to the available data) and Abstracts Views on Vision4Press platform.
Data correspond to usage on the plateform after 2015. The current usage metrics is available 48-96 hours after online publication and is updated daily on week days.
Initial download of the metrics may take a while.