Free Access
Fig. 3
Download original image
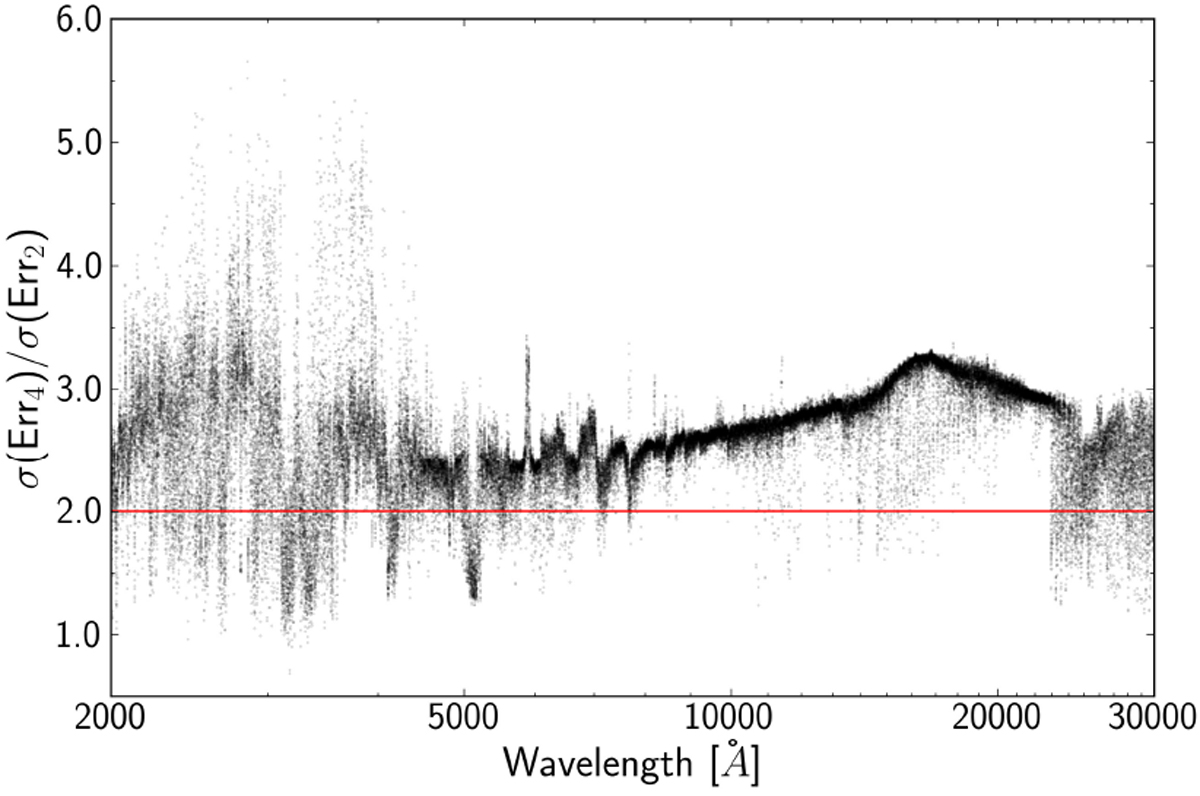
Quotient between the standard deviation (STD) of errors derived from the interpolation using the quarter subgrid as the model, and the STD of the errors using the half subgrid as model, for all wavelengths. A horizontal line is drawn at 2.0.
Current usage metrics show cumulative count of Article Views (full-text article views including HTML views, PDF and ePub downloads, according to the available data) and Abstracts Views on Vision4Press platform.
Data correspond to usage on the plateform after 2015. The current usage metrics is available 48-96 hours after online publication and is updated daily on week days.
Initial download of the metrics may take a while.