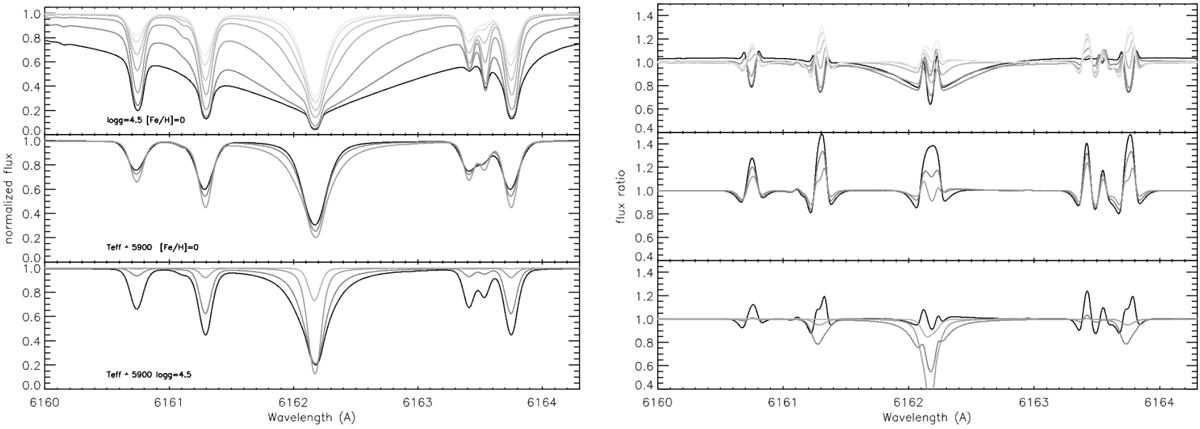
Fig. 2
Download original image
Variations of the 3D flux (left-hand panels) and the ratio of the 3D and 1D model fluxes in the vicinity of the Ca I 6162.18 Å line as a function of Teff (top panels; Teff = 4001, 4499, 5061, 5473, 5923, 6238, and 6456 K), log g (middle; log g = 3.5, 4.0 and 4.5) and [Fe/H] (lower panels; [Fe/H] = -1, -2 and Teff = 5923, -2 and Teff = 6287 K, and -3).
Current usage metrics show cumulative count of Article Views (full-text article views including HTML views, PDF and ePub downloads, according to the available data) and Abstracts Views on Vision4Press platform.
Data correspond to usage on the plateform after 2015. The current usage metrics is available 48-96 hours after online publication and is updated daily on week days.
Initial download of the metrics may take a while.