Fig. 8.
Download original image
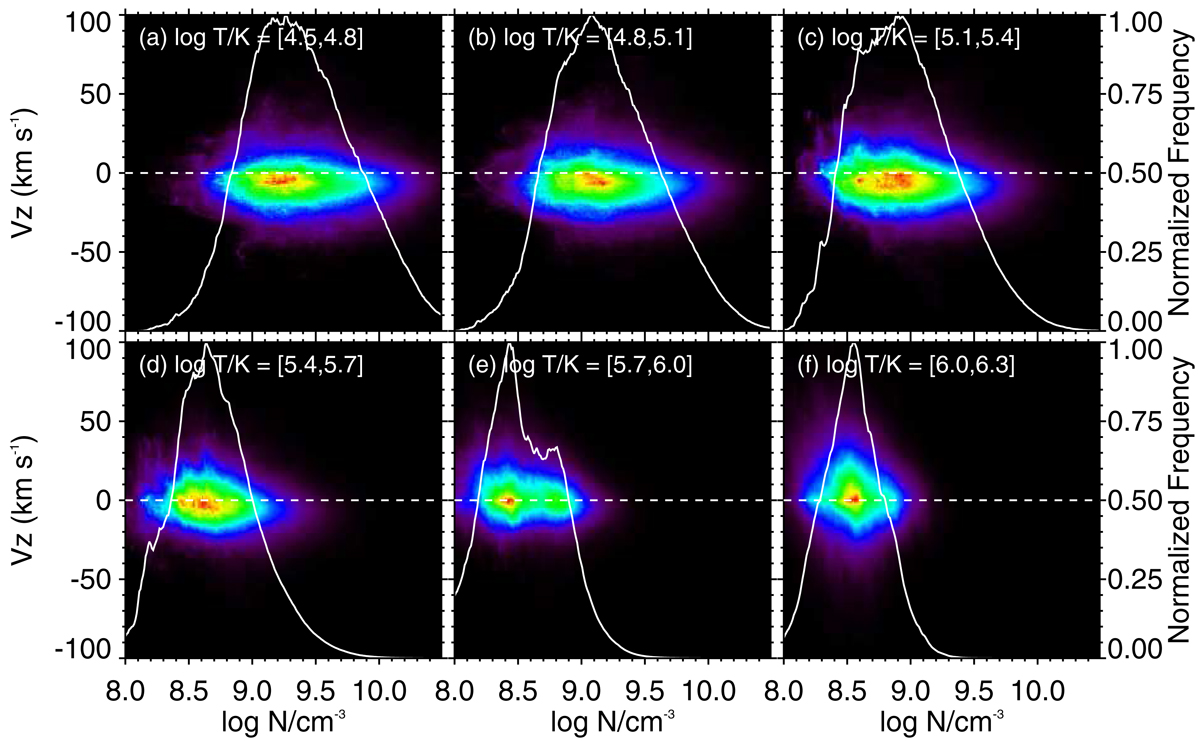
Joint probability density function (PDF) of vertical velocity and density at different temperature ranges. The respective temperature ranges (in logarithmic scale) are given with each plot. The white curves indicate the distribution of density in the respective temperature range. The horizontal white dashed lines indicate zero velocity. See Sect. 3.4 for more details.
Current usage metrics show cumulative count of Article Views (full-text article views including HTML views, PDF and ePub downloads, according to the available data) and Abstracts Views on Vision4Press platform.
Data correspond to usage on the plateform after 2015. The current usage metrics is available 48-96 hours after online publication and is updated daily on week days.
Initial download of the metrics may take a while.