Fig. 6.
Download original image
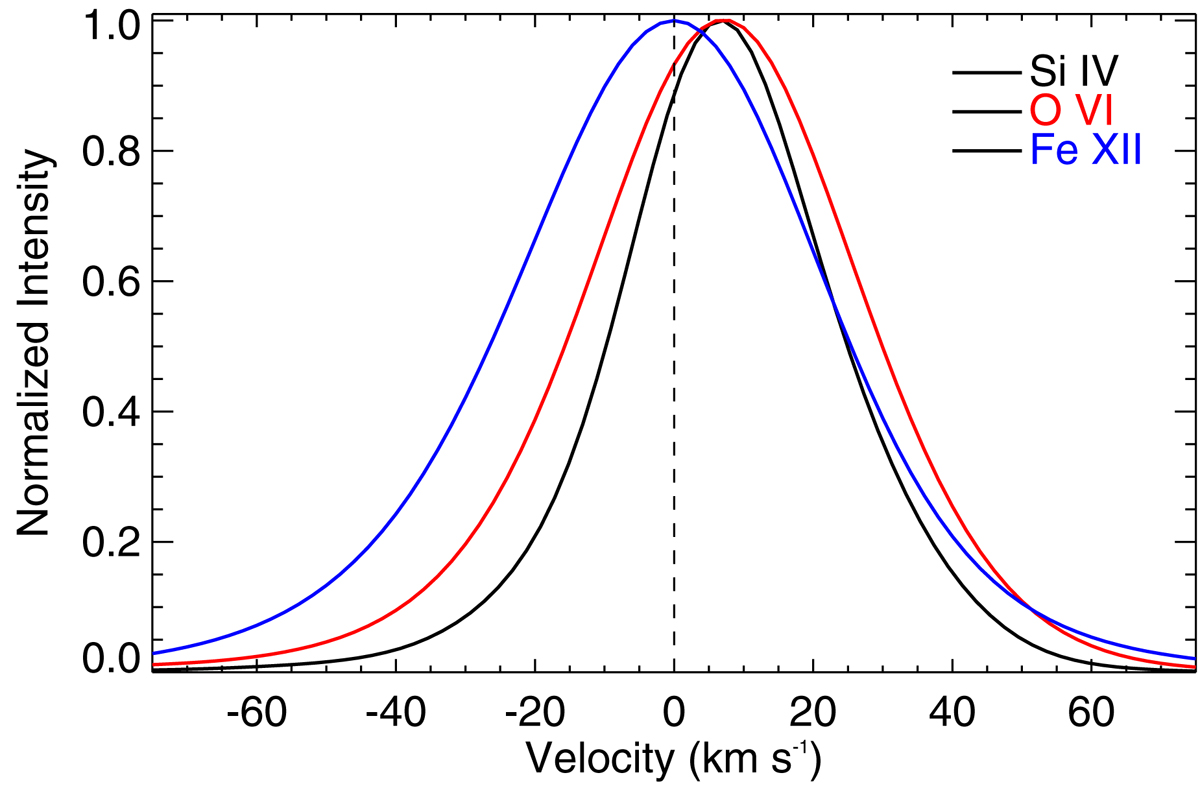
Average line profiles. The black, red, and blue curves show the profiles of the Si IV, O VI, and Fe XII lines averaged over the whole domain for a single snapshot. The Doppler shift of the profiles are +7.2, +5.6, and −1.1 km s−1, respectively. The vertical black dashed line indicates zero shift. See Sect. 3.4 for more details.
Current usage metrics show cumulative count of Article Views (full-text article views including HTML views, PDF and ePub downloads, according to the available data) and Abstracts Views on Vision4Press platform.
Data correspond to usage on the plateform after 2015. The current usage metrics is available 48-96 hours after online publication and is updated daily on week days.
Initial download of the metrics may take a while.