Fig. 4.
Download original image
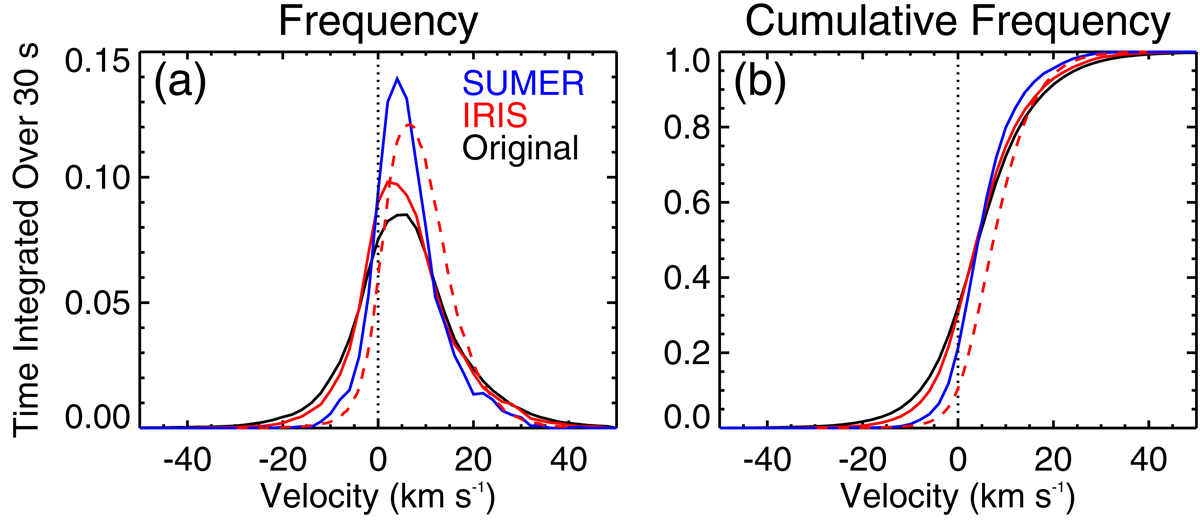
Histograms of the Doppler shifts of the Si IV line. The frequency (a) and cumulative frequency (b) of the Doppler shifts of the Si IV line after integration over 30 s as shown in Fig. 3a–c. The solid black, red, and blue lines indicate the distribution of the Si IV line at the original, IRIS, and SUMER resolution, respectively. The red dashed line indicates the distribution of the Si IV line calculated from the observation shown in Fig. 1. The vertical dotted line shows the zero shift. See Sect. 3.3 for more details.
Current usage metrics show cumulative count of Article Views (full-text article views including HTML views, PDF and ePub downloads, according to the available data) and Abstracts Views on Vision4Press platform.
Data correspond to usage on the plateform after 2015. The current usage metrics is available 48-96 hours after online publication and is updated daily on week days.
Initial download of the metrics may take a while.