Fig. 2.
Download original image
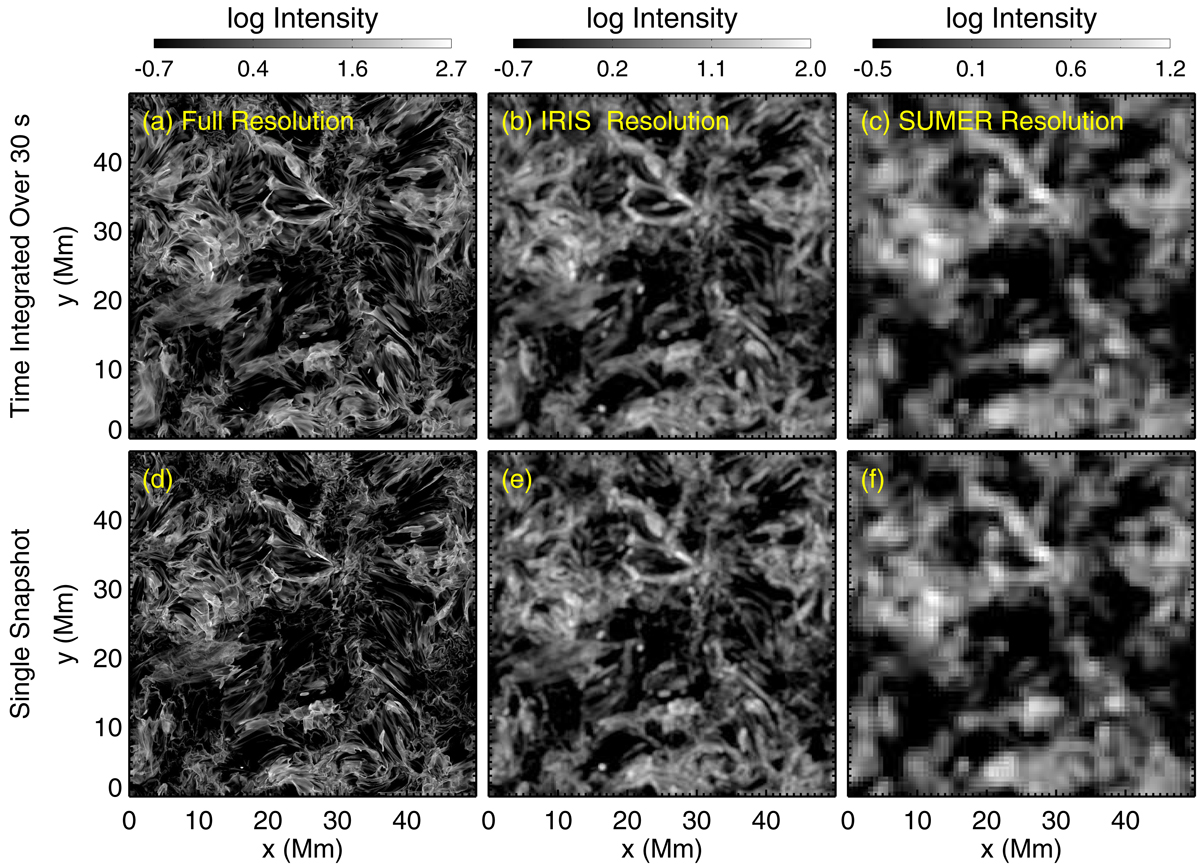
Intensity maps of the Si IV line at different spatial and temporal resolution. Intensity images of the Si IV line shown at (a) original resolution of the simulation, (b) IRIS resolution, and (c) SUMER resolution after integration over 30 s. (d)–(f) The same as (a)–(c), but for the first snapshot. The images are shown in a logarithmic scale normalized to the median value. The dynamic ranges of the intensity at full, IRIS, and SUMER resolution are 1000, 500, and 50, respectively. See Sect. 3.3 for more details.
Current usage metrics show cumulative count of Article Views (full-text article views including HTML views, PDF and ePub downloads, according to the available data) and Abstracts Views on Vision4Press platform.
Data correspond to usage on the plateform after 2015. The current usage metrics is available 48-96 hours after online publication and is updated daily on week days.
Initial download of the metrics may take a while.