Fig. 10.
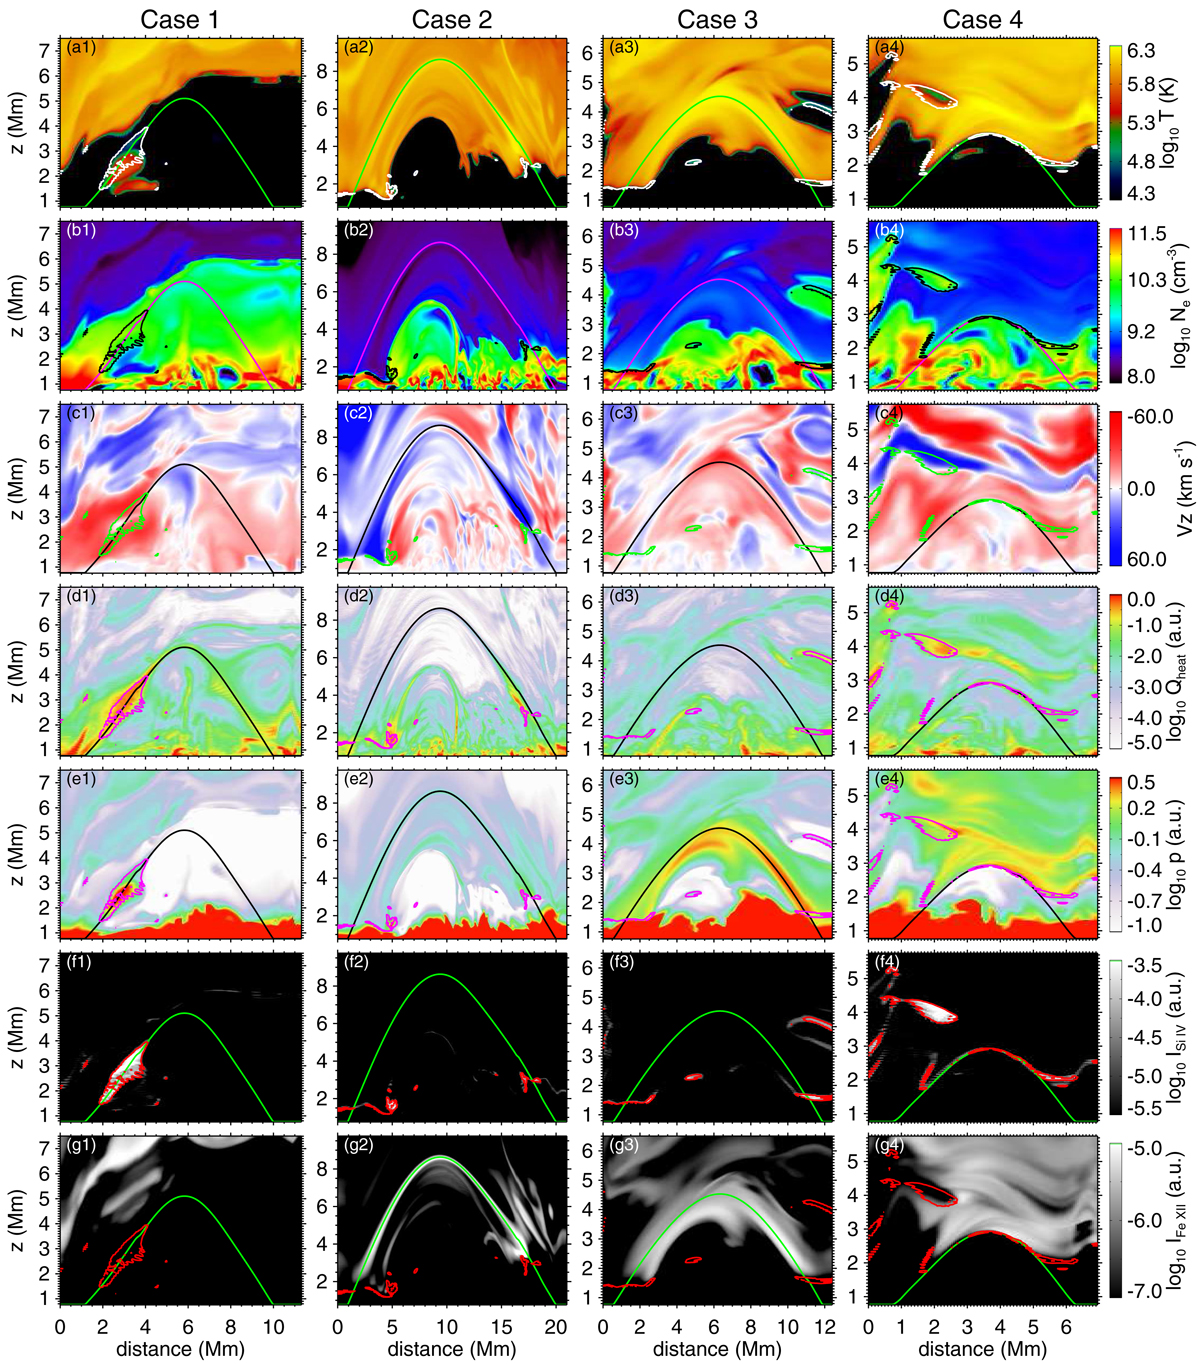
Download original image
Vertical maps of various properties in and around selected loops. From top to bottom: we display the temperature, electron number density, vertical velocity, total heating rate, pressure, Si IV emission, and Fe XII emission. The four columns show sample cases for the processes described in Sects. 4.2.1 to 4.2.4. The colored line in each panel shows the respective magnetic field lines. The contours outline regions with enhanced Si IV emission. The vertical maps were constructed by first projecting each field onto the horizontal x-y-plane and then combining the variations along the z-direction into a single map. Essentially, these vertical maps are close to vertical cuts. See Sect. 4.2 for more details.
Current usage metrics show cumulative count of Article Views (full-text article views including HTML views, PDF and ePub downloads, according to the available data) and Abstracts Views on Vision4Press platform.
Data correspond to usage on the plateform after 2015. The current usage metrics is available 48-96 hours after online publication and is updated daily on week days.
Initial download of the metrics may take a while.