Fig. 1.
Download original image
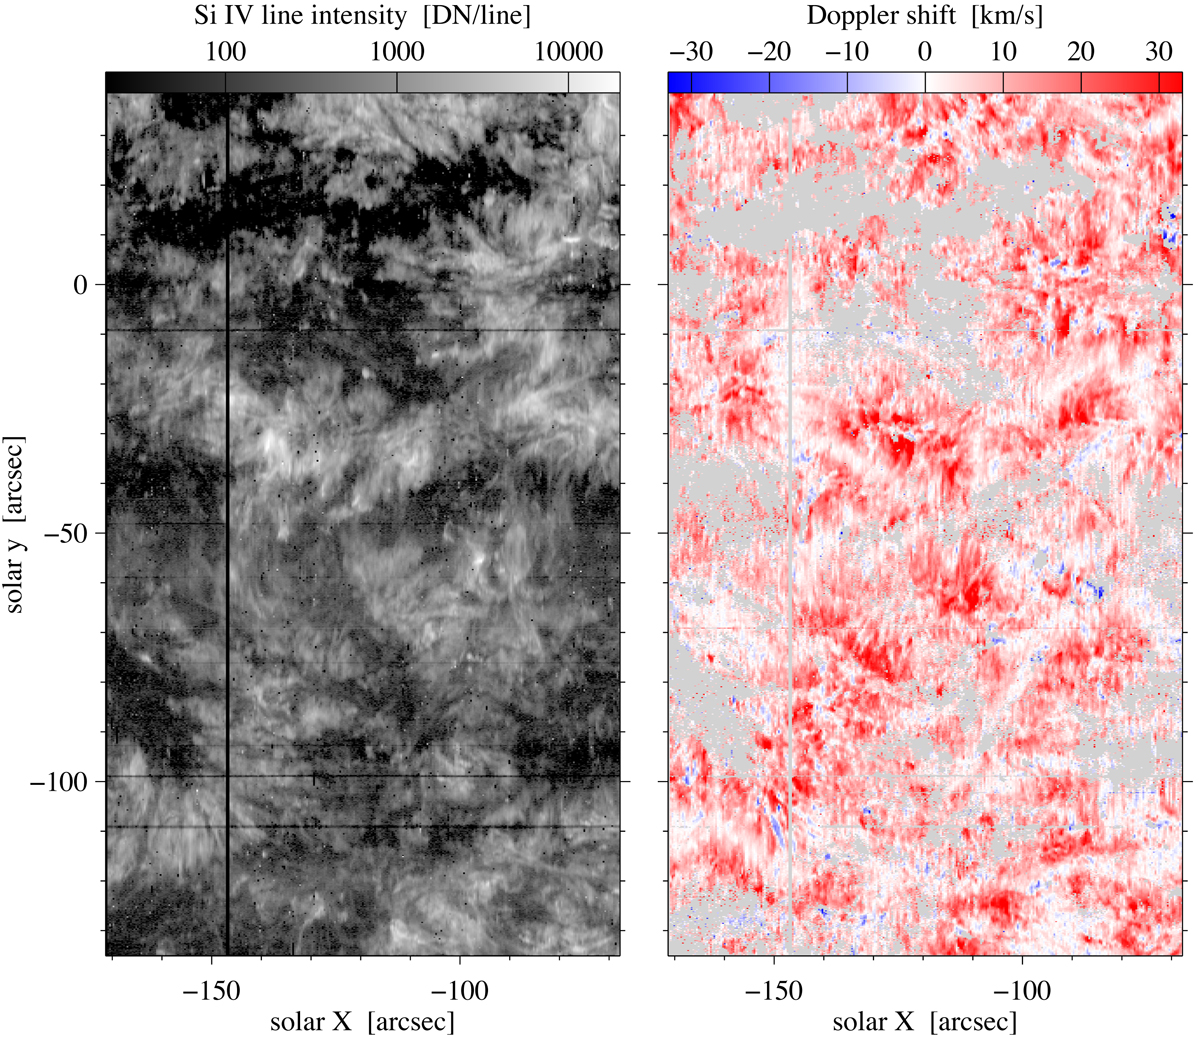
Observation of the line intensity and Doppler shift of Si IV 1394 Å in the quiet Sun. The data were taken with IRIS with a field of view of 104″ × 174″ centered around solar (X,Y) = ( − 120″, −48″), i.e., close to disk center. The intensity map is displayed on a logarithmic scale. Gray regions in the Doppler map mark areas where the signal is too low to perform a reliable Gaussian fit (below ca. 15% of the mean intensity or 80 DN/line for this data set). See Sect. 2 for more details.
Current usage metrics show cumulative count of Article Views (full-text article views including HTML views, PDF and ePub downloads, according to the available data) and Abstracts Views on Vision4Press platform.
Data correspond to usage on the plateform after 2015. The current usage metrics is available 48-96 hours after online publication and is updated daily on week days.
Initial download of the metrics may take a while.