Free Access
Fig. A.1.
Download original image
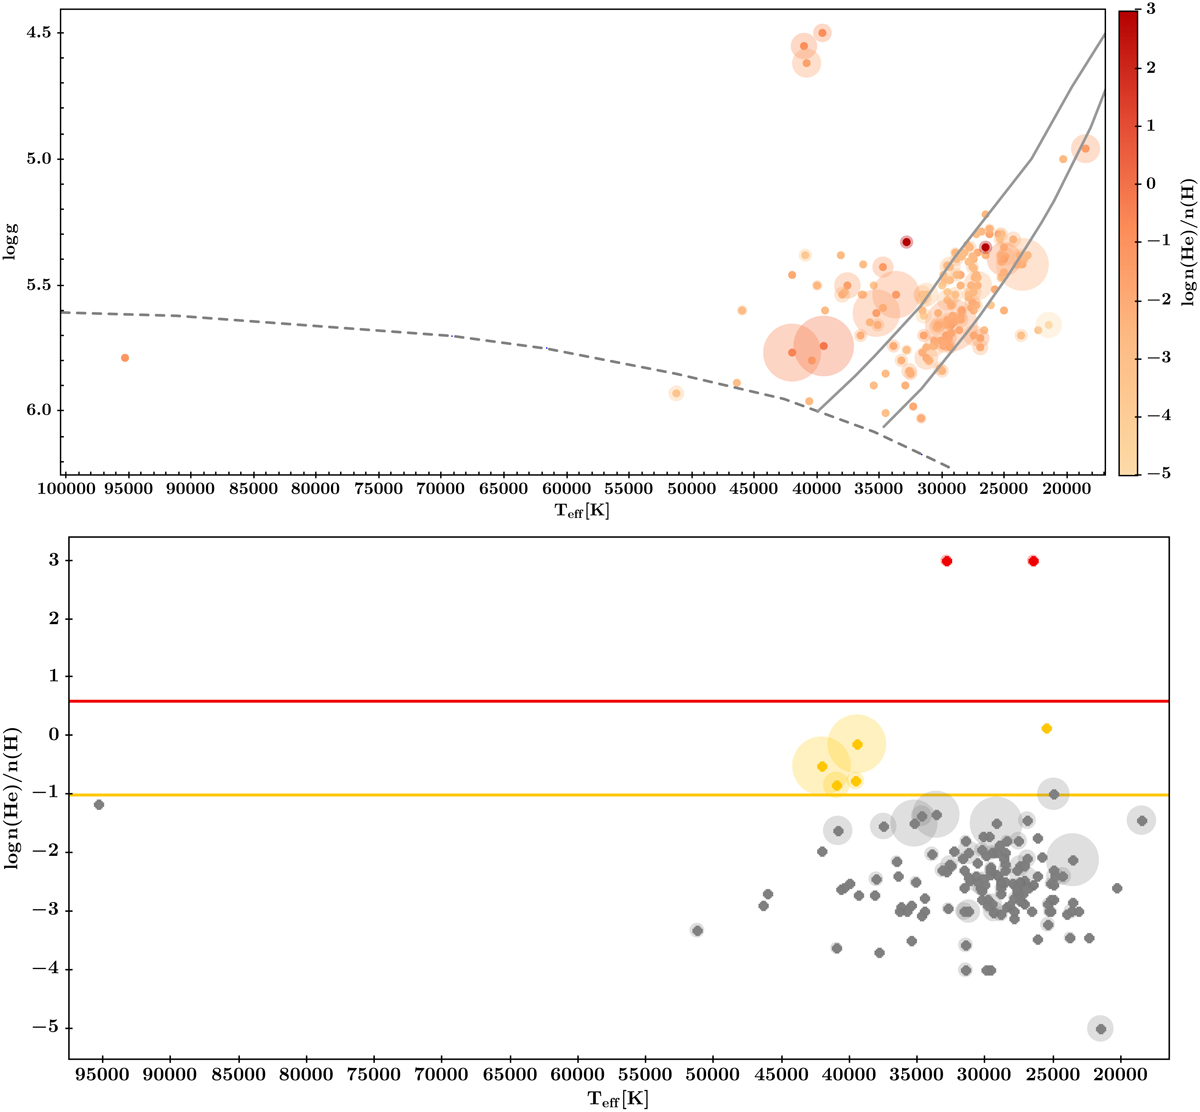
Solved hot subdwarf binaries from the literature. Upper panel: Teff − log g diagram of the sample of solved close hot subdwarf binaries similar to Fig. 1. Lower panel: Teff − log n(He)/n(H) diagram of the solved systems similar to Fig. 2. The scaling of the symbol sizes is different and was chosen for better visualisation.
Current usage metrics show cumulative count of Article Views (full-text article views including HTML views, PDF and ePub downloads, according to the available data) and Abstracts Views on Vision4Press platform.
Data correspond to usage on the plateform after 2015. The current usage metrics is available 48-96 hours after online publication and is updated daily on week days.
Initial download of the metrics may take a while.