Fig. 4.
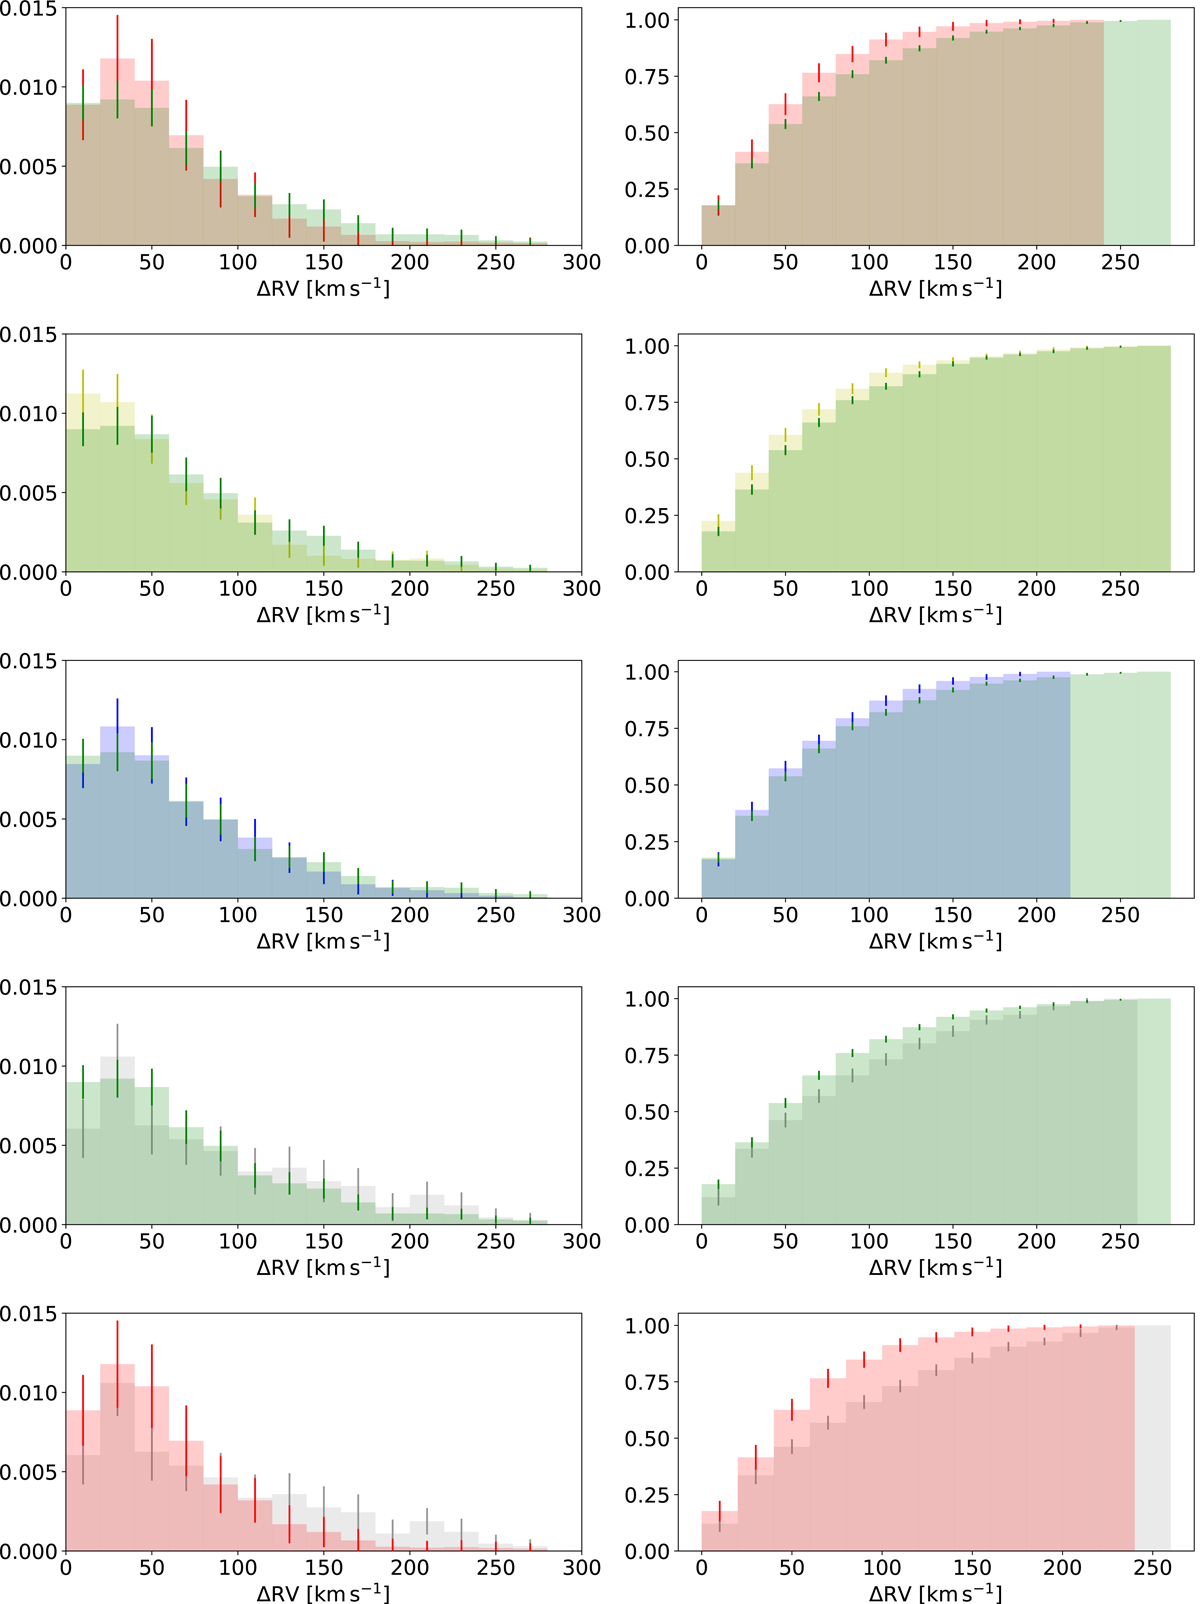
Download original image
Comparison of the normalised Δ RVmax distributions (left panels) and the normalised cumulative Δ RVmax distributions (right panels) in the different regions. From top to bottom: EHB1 (red) and EHB2 (green), EHB3 (yellow) and EHB2 (green), postEHB (blue) and EHB2 (green), bEHB (grey) and EHB2 (green), and bEHB (grey) and EHB1 (red). It ought to be pointed out that the contribution of stars with high RV shifts tends to be visually over-represented in the cumulative distributions and is better visible in the normalised distributions.
Current usage metrics show cumulative count of Article Views (full-text article views including HTML views, PDF and ePub downloads, according to the available data) and Abstracts Views on Vision4Press platform.
Data correspond to usage on the plateform after 2015. The current usage metrics is available 48-96 hours after online publication and is updated daily on week days.
Initial download of the metrics may take a while.