Fig. 3.
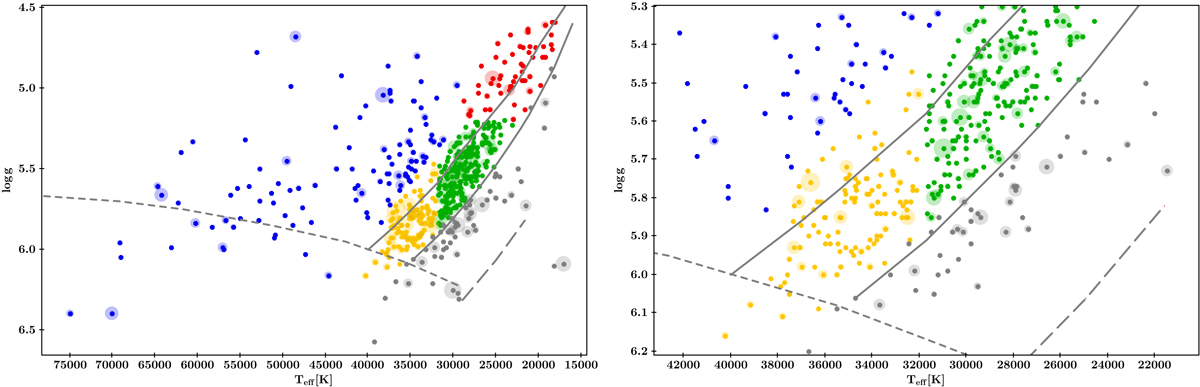
Download original image
RV variability and position in the Teff − log g diagram. Left panel: Teff − log g diagram similar to Fig. 1 of the sample of He-poor sdO/Bs with different regions marked by colour (EHB1 red, EHB2 green, EHB3 yellow, postEHB blue, bEHB grey) and the size of the symbol encoding Δ RVmax. In addition to the canonical EHB for a mass of 0.47 M⊙ (Dorman et al. 1993) the EHB for a low mass of 0.35 M⊙ (Han et al. 2002) is plotted as long-dashed grey line. Right panel: close-up of the same diagram showing the division between the regions EHB2 and EHB3 in more detail.
Current usage metrics show cumulative count of Article Views (full-text article views including HTML views, PDF and ePub downloads, according to the available data) and Abstracts Views on Vision4Press platform.
Data correspond to usage on the plateform after 2015. The current usage metrics is available 48-96 hours after online publication and is updated daily on week days.
Initial download of the metrics may take a while.