Fig. 2.
Download original image
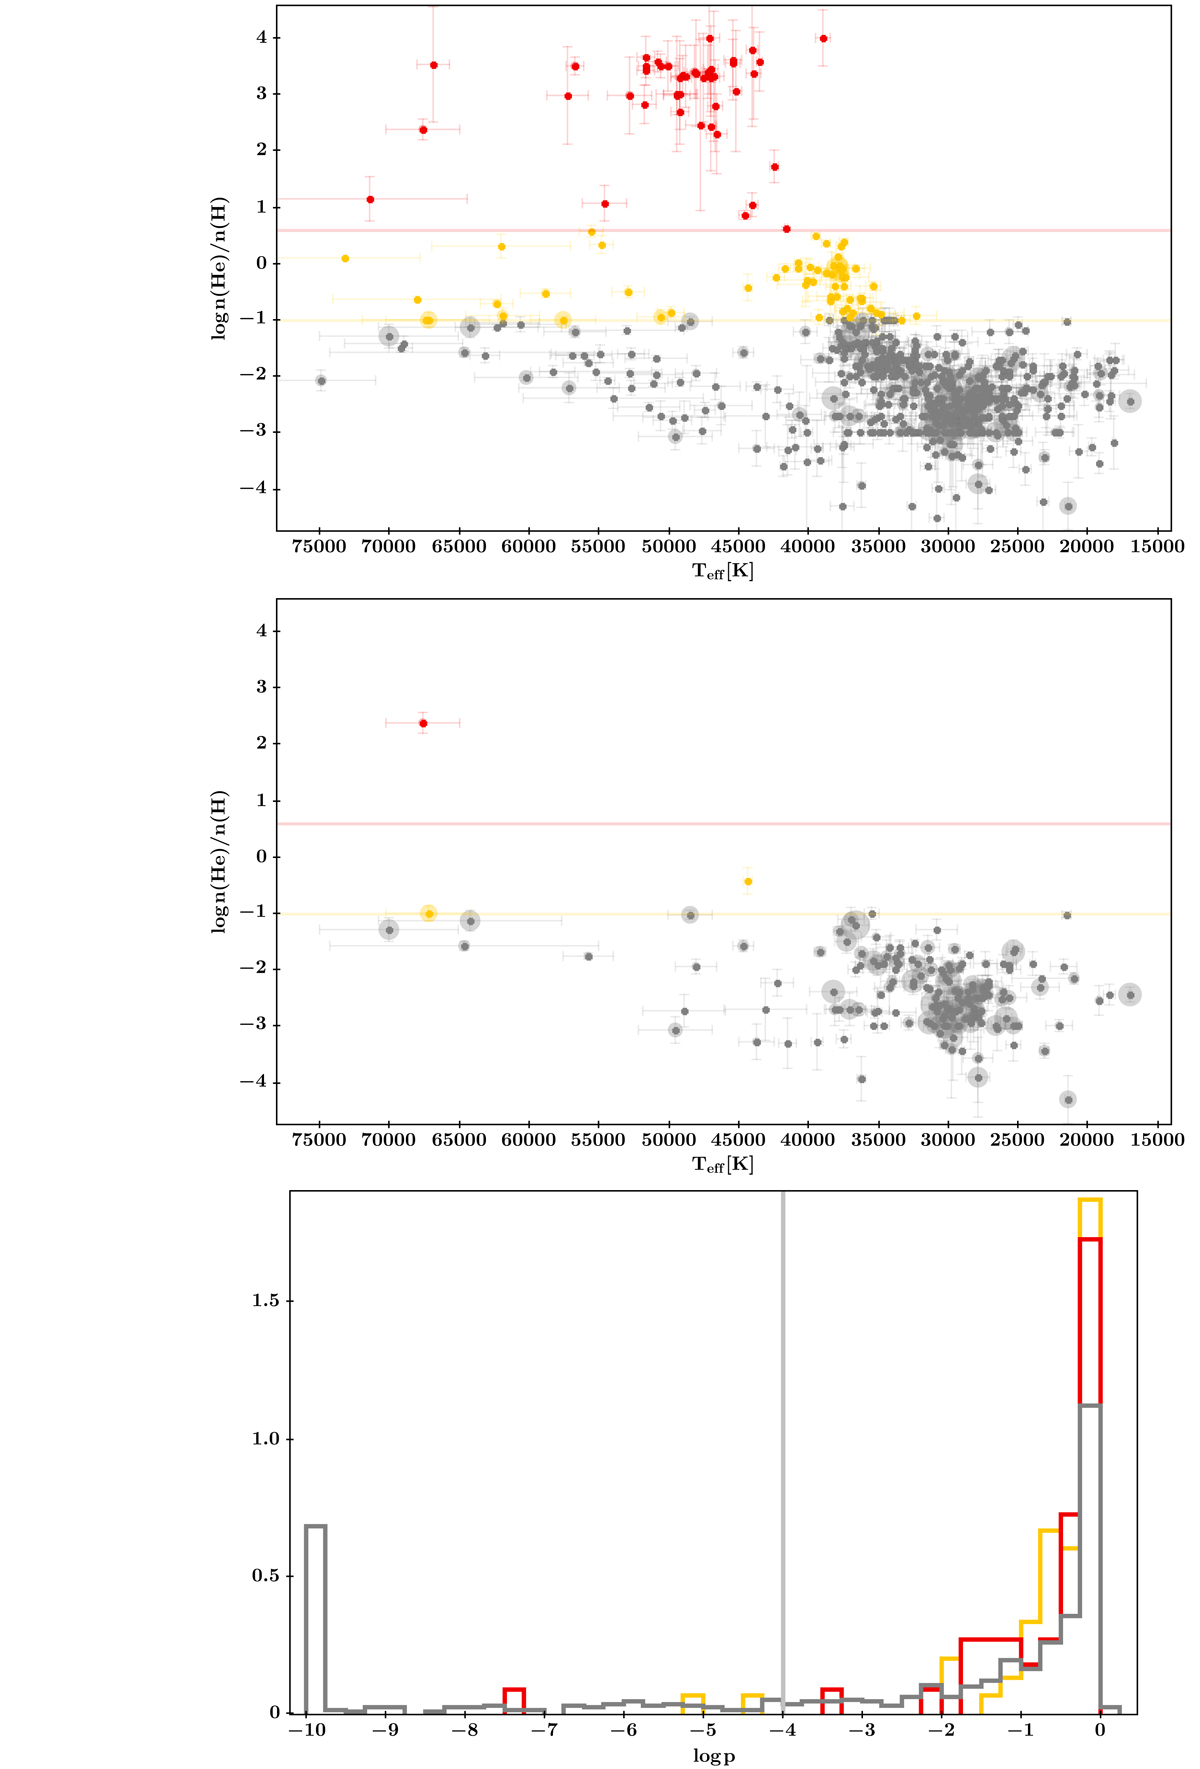
RV variability and helium abundance. Upper panel: Teff − log n(He)/n(H) diagram of the full sample. Helium-poor stars are marked in grey, intermediate helium-rich ones in orange and extreme helium-rich ones in red. The size of the symbols scales with ΔRVmax. Solar helium abundance is marked by the orange horizontal line, while the red line marks the transition between intermediate and extreme helium abundance. Middle panel: same diagram for the stars showing significant RV variability (log p < −4.0). Lower panel: log p distribution of the sample using the same colour-coding as in the upper panels. The significance level log p < −4.0 is marked by a vertical line. The distribution has been limited to log p > −10 and all objects with smaller log p have been stacked in the first bin for visualisation.
Current usage metrics show cumulative count of Article Views (full-text article views including HTML views, PDF and ePub downloads, according to the available data) and Abstracts Views on Vision4Press platform.
Data correspond to usage on the plateform after 2015. The current usage metrics is available 48-96 hours after online publication and is updated daily on week days.
Initial download of the metrics may take a while.