Fig. 1.
Download original image
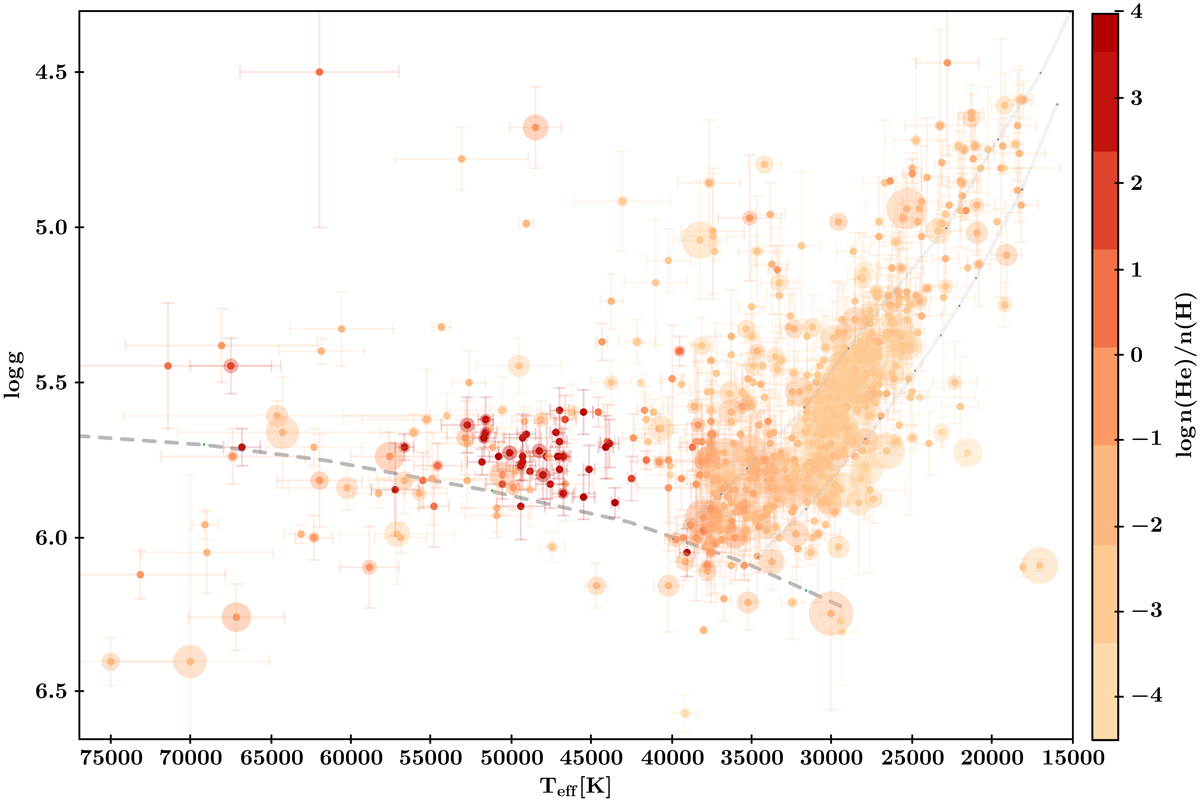
Teff − log g diagram of the full sample of hot subluminous stars. The size of the symbols scales with ΔRVmax, the colour with the helium abundance from light orange to red. The EHB band (solid lines) is based on evolutionary tracks with subsolar metallicity (log z = −1.48) from Dorman et al. (1993). The helium main sequence (dashed line) is taken from Paczynski (1971).
Current usage metrics show cumulative count of Article Views (full-text article views including HTML views, PDF and ePub downloads, according to the available data) and Abstracts Views on Vision4Press platform.
Data correspond to usage on the plateform after 2015. The current usage metrics is available 48-96 hours after online publication and is updated daily on week days.
Initial download of the metrics may take a while.