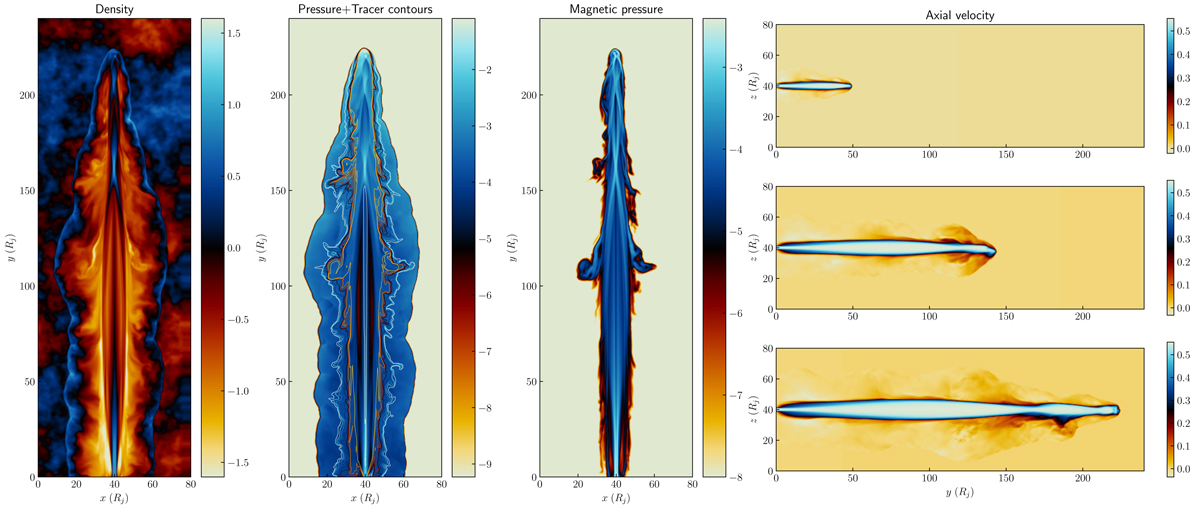
Fig. 6.
Download original image
Axial cuts of jet B simulation. Vertical panels: Logarithmic rest-mass density, logarithmic gas pressure, and logarithmic magnetic pressure at t = 560 (Rj/c). Ten tracer contours are overplotted together with the gas pressure, from f ≈ 0 (white to blue) to f = 1 (yellow to white). Horizontal panels: Evolution of the jet velocity at t = 110 (top), t = 360 (middle), and t = 560 (bottom) (Rj/c).
Current usage metrics show cumulative count of Article Views (full-text article views including HTML views, PDF and ePub downloads, according to the available data) and Abstracts Views on Vision4Press platform.
Data correspond to usage on the plateform after 2015. The current usage metrics is available 48-96 hours after online publication and is updated daily on week days.
Initial download of the metrics may take a while.