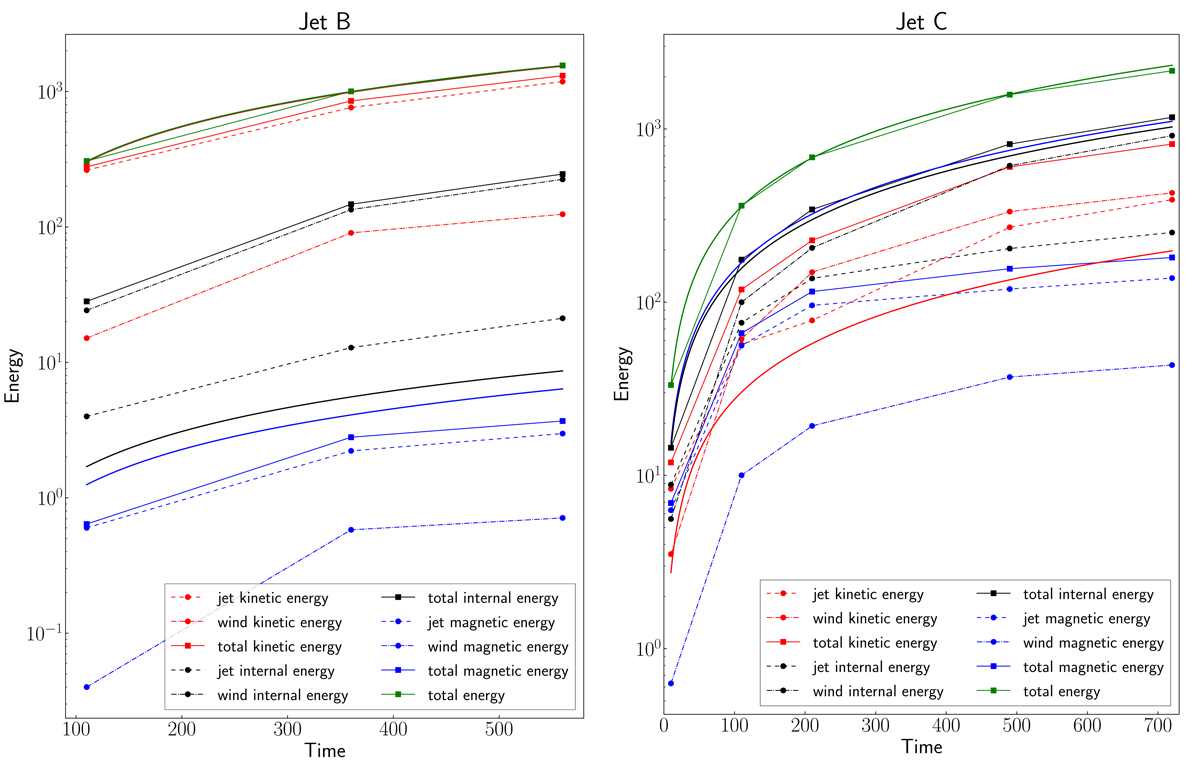
Fig. 10.
Download original image
Time evolution of the logarithm of the energy in the simulation for jet B (left) and jet C (right) at the three time frames of Figs. 6 and 8, respectively. In the right panel (jet C), we have included two additional time frames at t = 10 (Rj/c) and t = 110 (Rj/c). Energy stored by the jet plasma (f ≠ 0) is represented with dots and dashed lines, ambient medium energies (f = 0) with dots and dash-dotted lines, and total energies (jet+ambient medium) with squares and solid lines. Continuous solid lines (without marks) are the theoretical curves (i.e., the injected values) for each type of energy: kinetic (red), internal (black), magnetic (blue), and total (green). Energy units are ![]() .
.
Current usage metrics show cumulative count of Article Views (full-text article views including HTML views, PDF and ePub downloads, according to the available data) and Abstracts Views on Vision4Press platform.
Data correspond to usage on the plateform after 2015. The current usage metrics is available 48-96 hours after online publication and is updated daily on week days.
Initial download of the metrics may take a while.