Fig. 5
Download original image
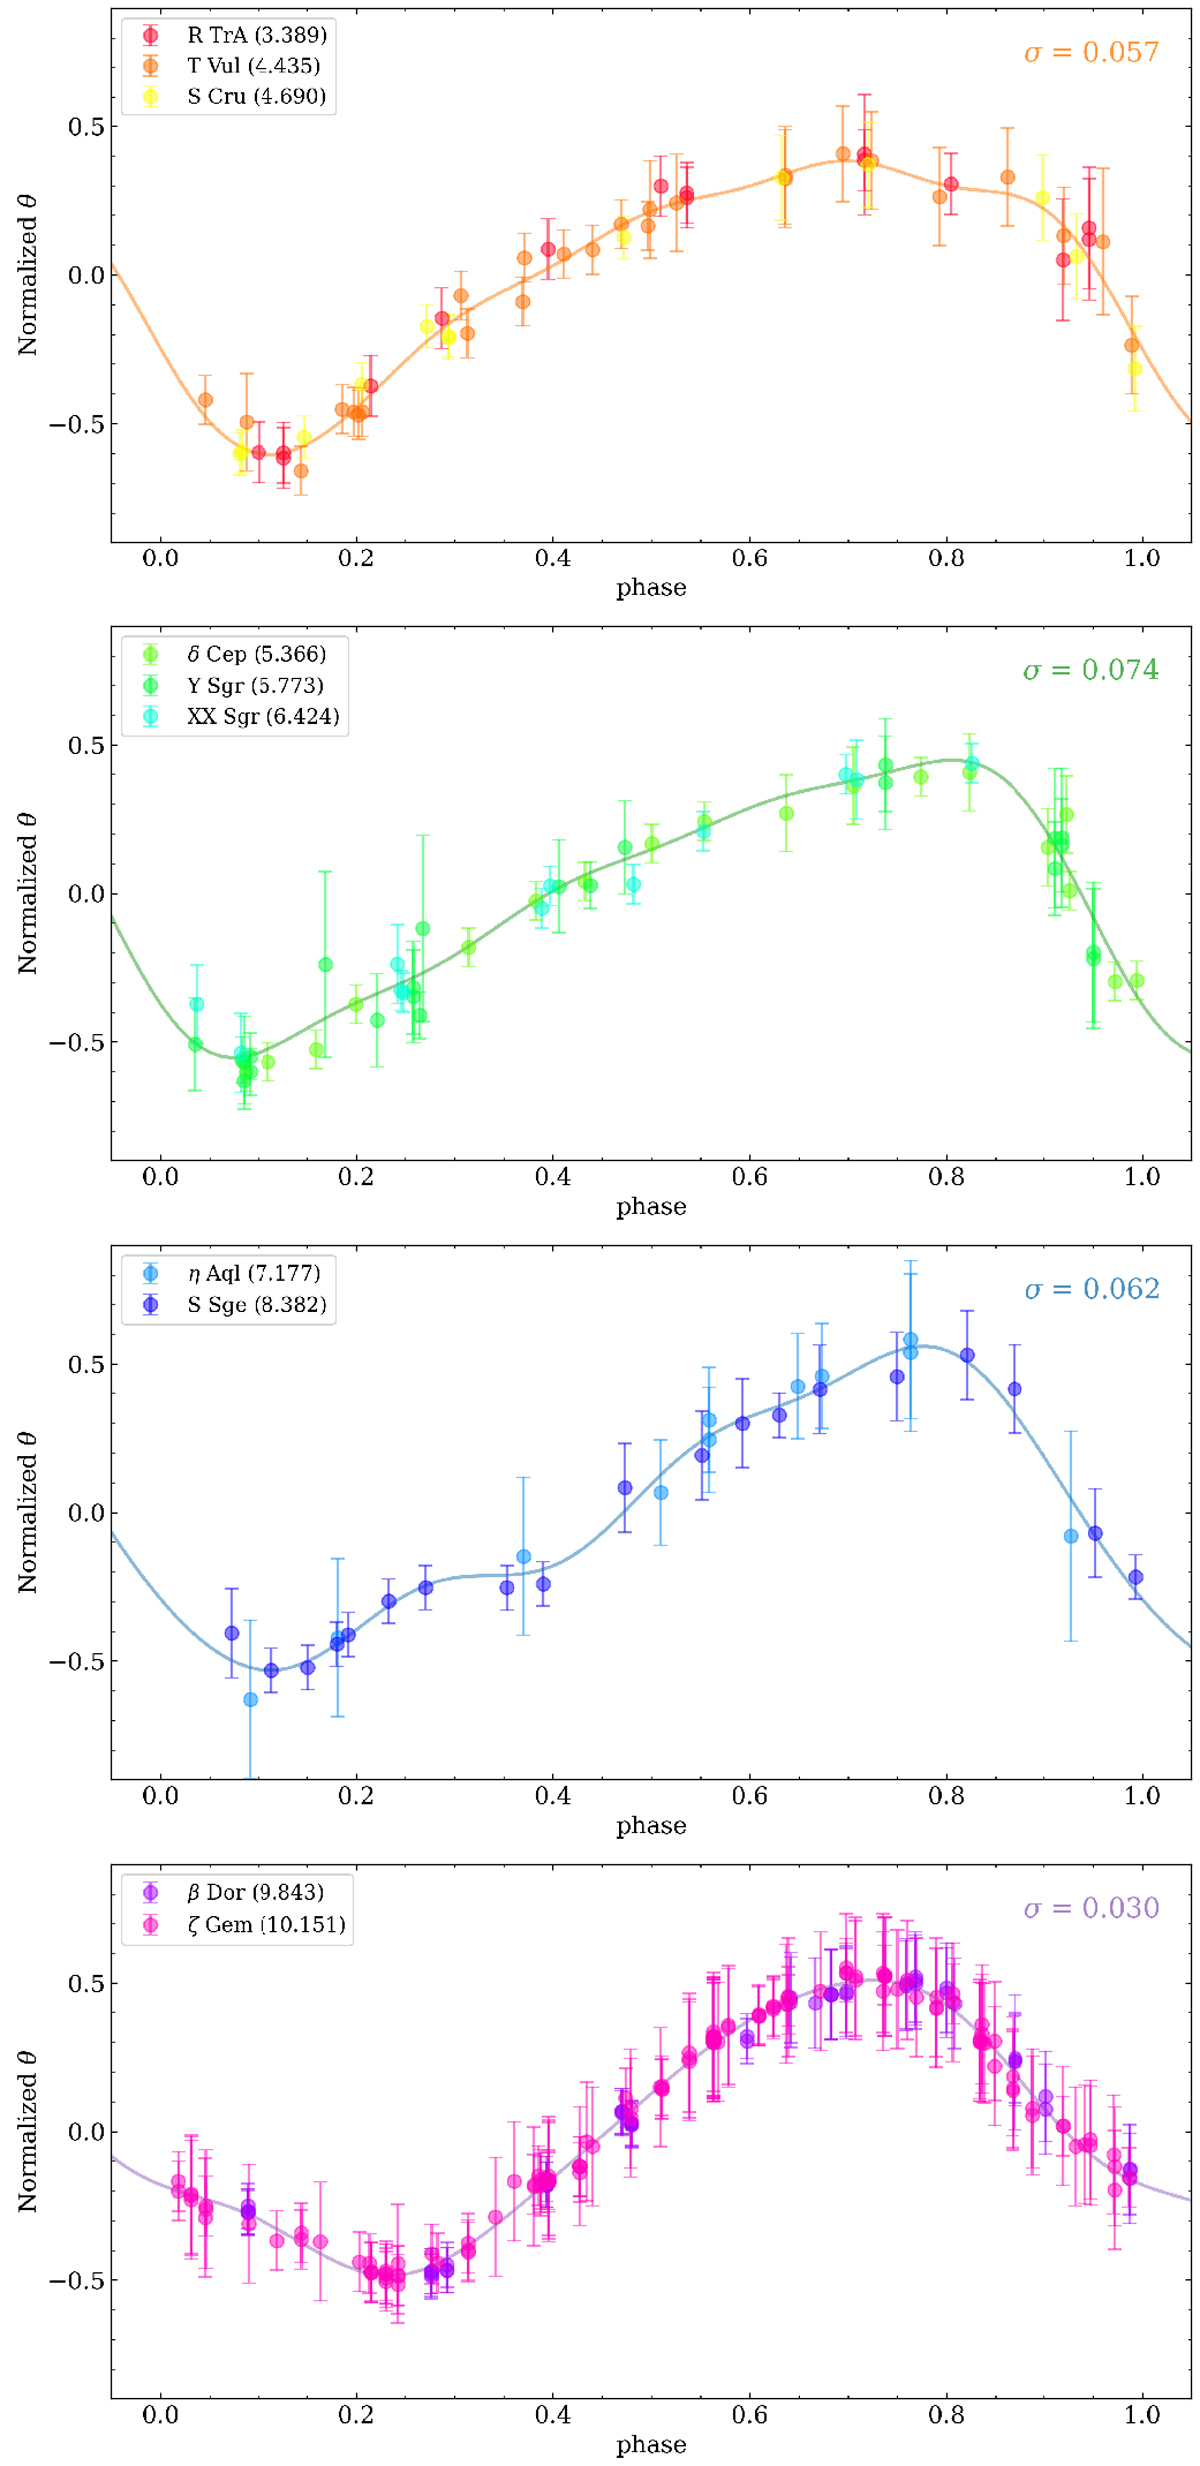
Normalized θ (5040/Teff) as a function of the pulsation phase. The panels show the phase-folded curves separating the Cepheids in different bins of pulsation period (values within parentheses): from 3 to 5 days, from 5 to 7 days, from 7 to 9.5 days, and from 9.5 to 10.5 days. For the variable S Sge, the two outliers shown in Fig. B.2 were not used in the construction of the Teff curve templates. The curves display the fit of the Fourier series to the data (see Table 7). The standard deviations of the fit are also shown.
Current usage metrics show cumulative count of Article Views (full-text article views including HTML views, PDF and ePub downloads, according to the available data) and Abstracts Views on Vision4Press platform.
Data correspond to usage on the plateform after 2015. The current usage metrics is available 48-96 hours after online publication and is updated daily on week days.
Initial download of the metrics may take a while.