Free Access
Fig. 4
Download original image
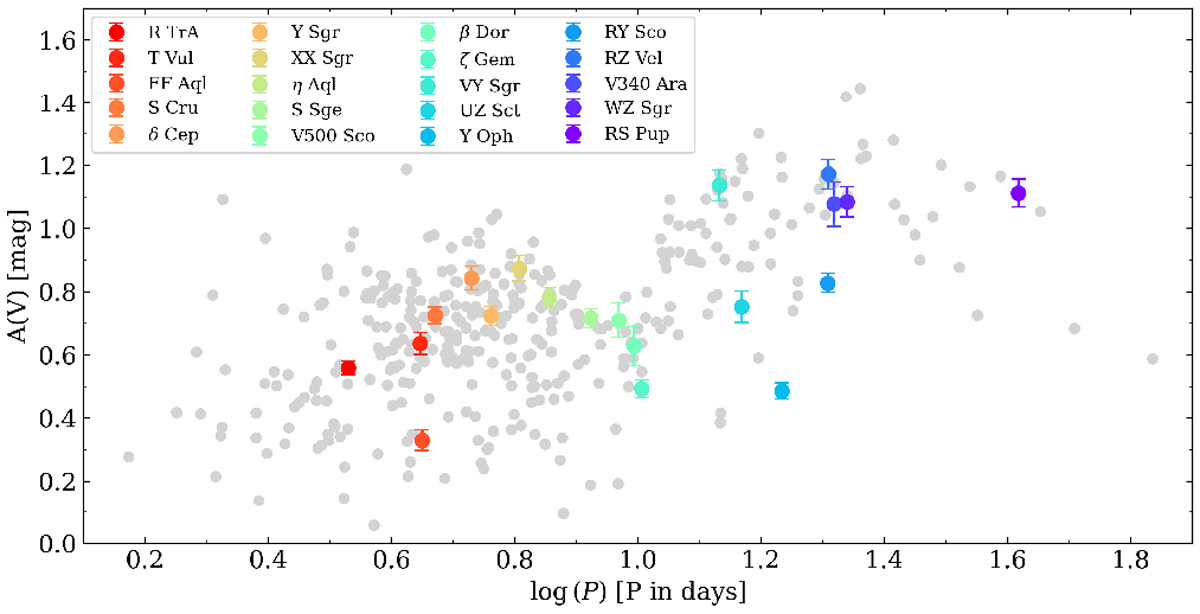
Photometric amplitude as a function of the logarithmic period (Bailey diagram). Our calibrating Cepheids are represented by colored symbols, whereas the Cepheids from literature (Luck et al. 2011; Luck & Lambert 2011; Lemasle et al. 2013; Yong et al. 2006) are shown in light gray circles.
Current usage metrics show cumulative count of Article Views (full-text article views including HTML views, PDF and ePub downloads, according to the available data) and Abstracts Views on Vision4Press platform.
Data correspond to usage on the plateform after 2015. The current usage metrics is available 48-96 hours after online publication and is updated daily on week days.
Initial download of the metrics may take a while.