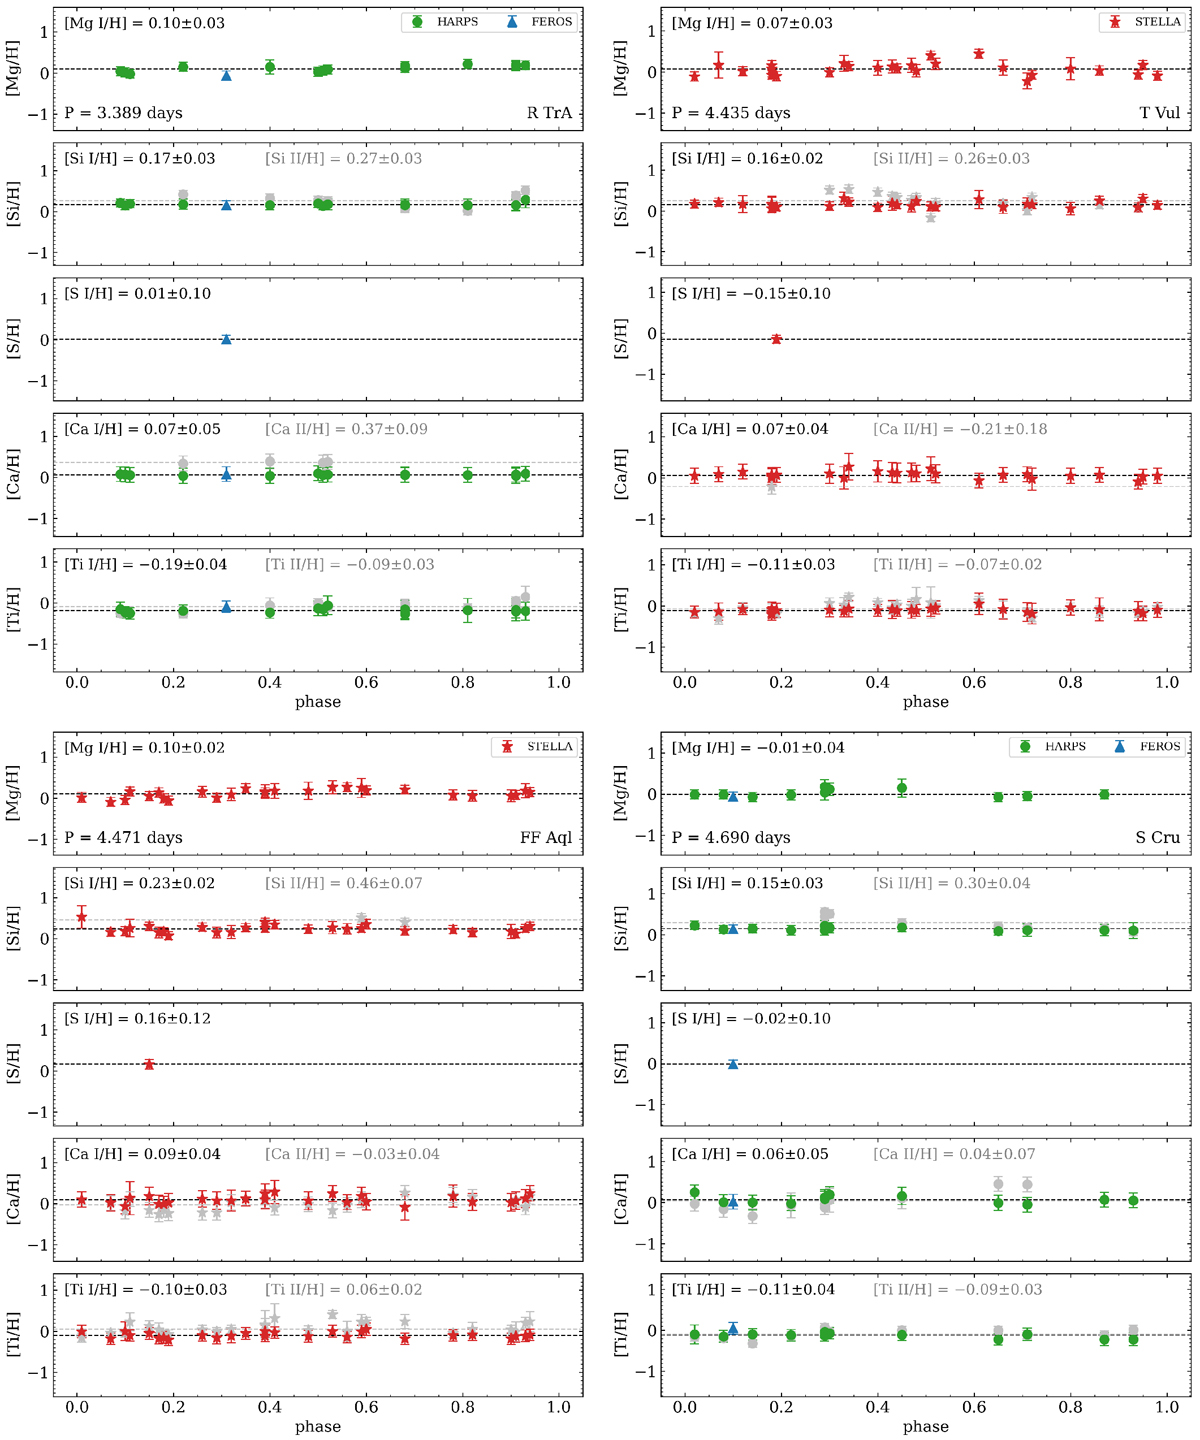
Fig. B.6
Download original image
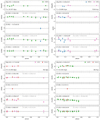
[X/H] abundances as a function of the pulsation phase. Each panel shows the abundances of α elements from neutral and ionized lines as listed in Tables 8 and 9. As explained in the text, the sulfur abundances were derived using the spectral synthesis method applied to one spectrum of each star (an exception are the stars ηAql, VY Sgr, and V340 Ara, for which the [S/H] abundances could not be derived due to the noisy profile of the sulfur line used).
Current usage metrics show cumulative count of Article Views (full-text article views including HTML views, PDF and ePub downloads, according to the available data) and Abstracts Views on Vision4Press platform.
Data correspond to usage on the plateform after 2015. The current usage metrics is available 48-96 hours after online publication and is updated daily on week days.
Initial download of the metrics may take a while.