Free Access
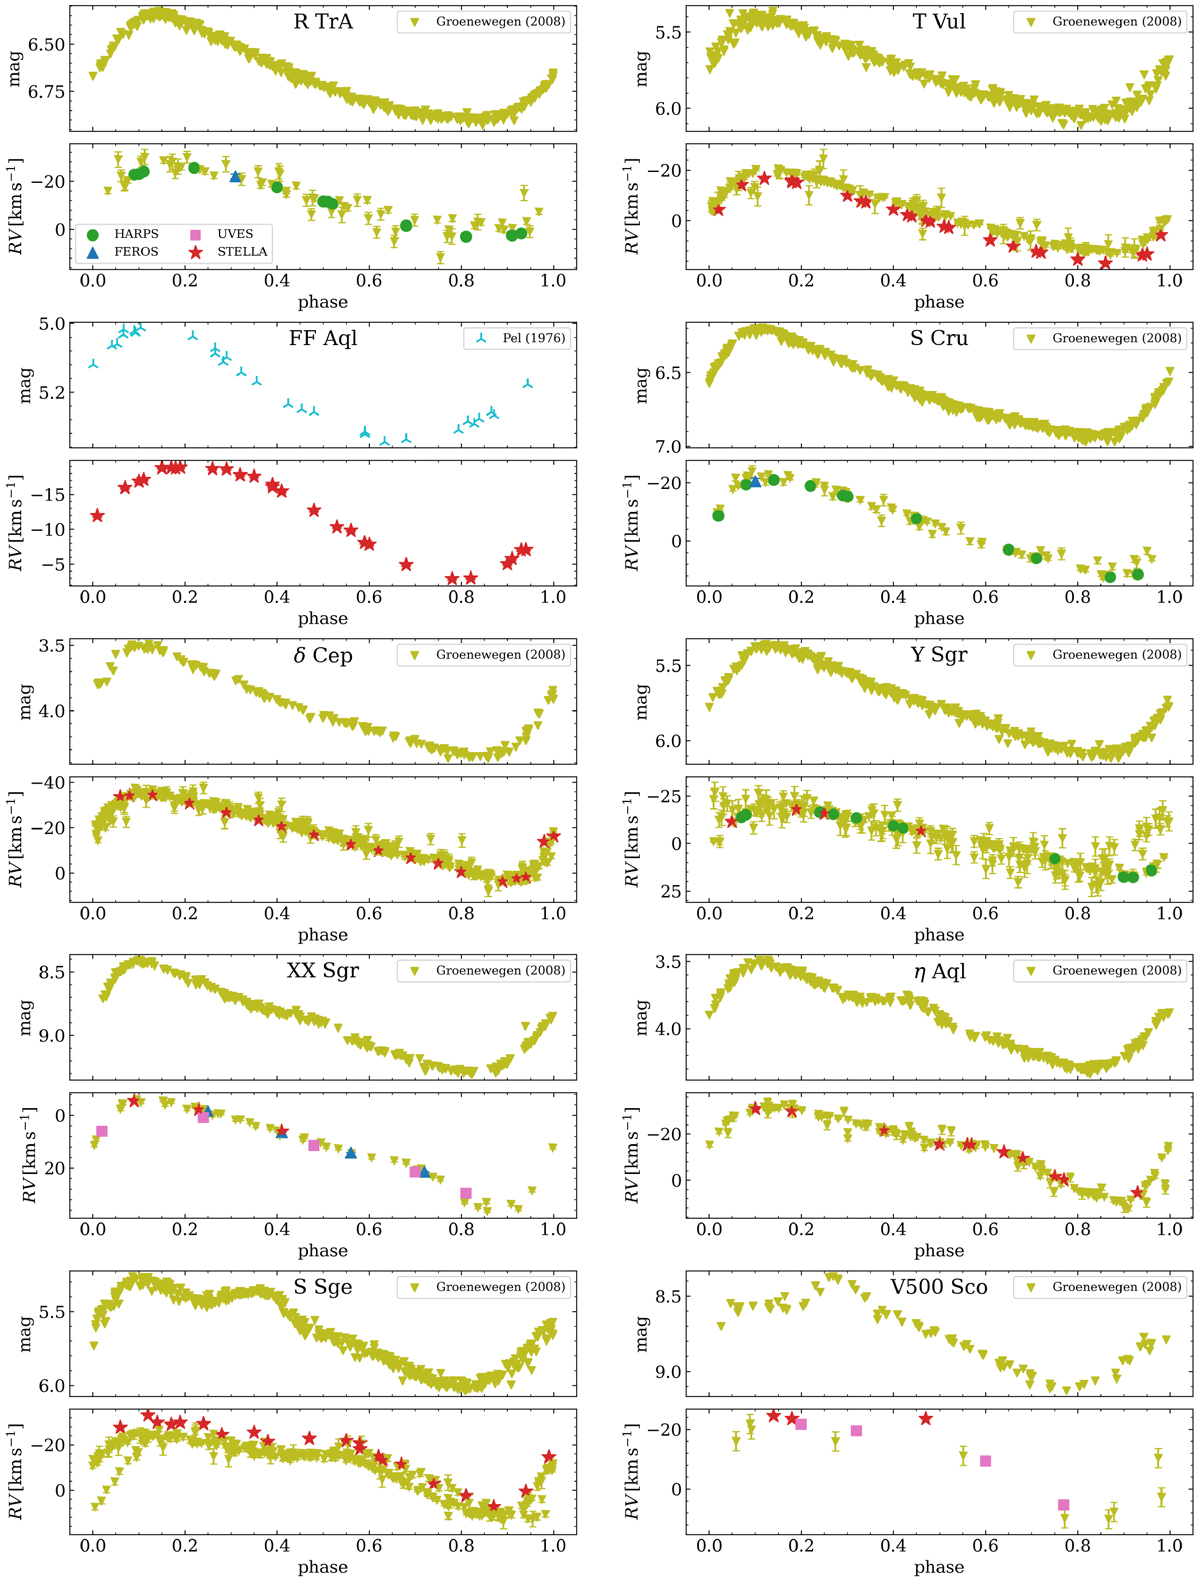
Fig. B.1
Download original image
Magnitude (visual bands) and radial velocities as a function of the pulsation phase. Measurements from different spectrographs are indicated with different colors and symbols. The error bars in some cases are smaller than the symbol size.
This figure is made of several images, please see below:
Current usage metrics show cumulative count of Article Views (full-text article views including HTML views, PDF and ePub downloads, according to the available data) and Abstracts Views on Vision4Press platform.
Data correspond to usage on the plateform after 2015. The current usage metrics is available 48-96 hours after online publication and is updated daily on week days.
Initial download of the metrics may take a while.