Free Access
Fig. A.5
Download original image
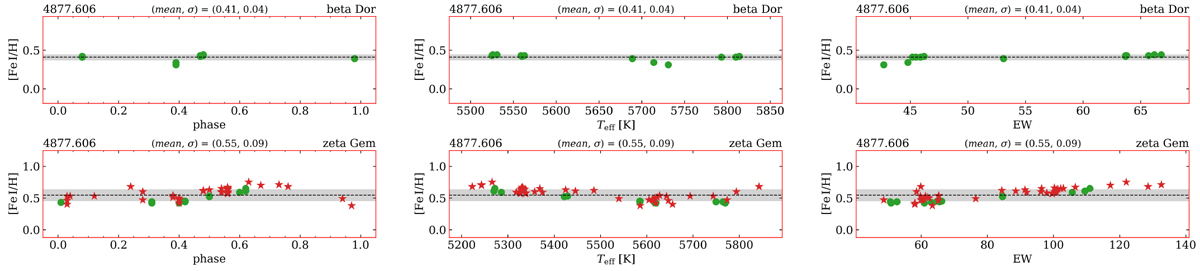
Iron under- or overabundances. Same as in Fig. A.1 but showing an example of a line that (even if the dispersion in abundance is very small) was excluded from the initial line list because of its having an unexpected overabundance in metallicity, possibly caused by an erroneous log gf value.
Current usage metrics show cumulative count of Article Views (full-text article views including HTML views, PDF and ePub downloads, according to the available data) and Abstracts Views on Vision4Press platform.
Data correspond to usage on the plateform after 2015. The current usage metrics is available 48-96 hours after online publication and is updated daily on week days.
Initial download of the metrics may take a while.