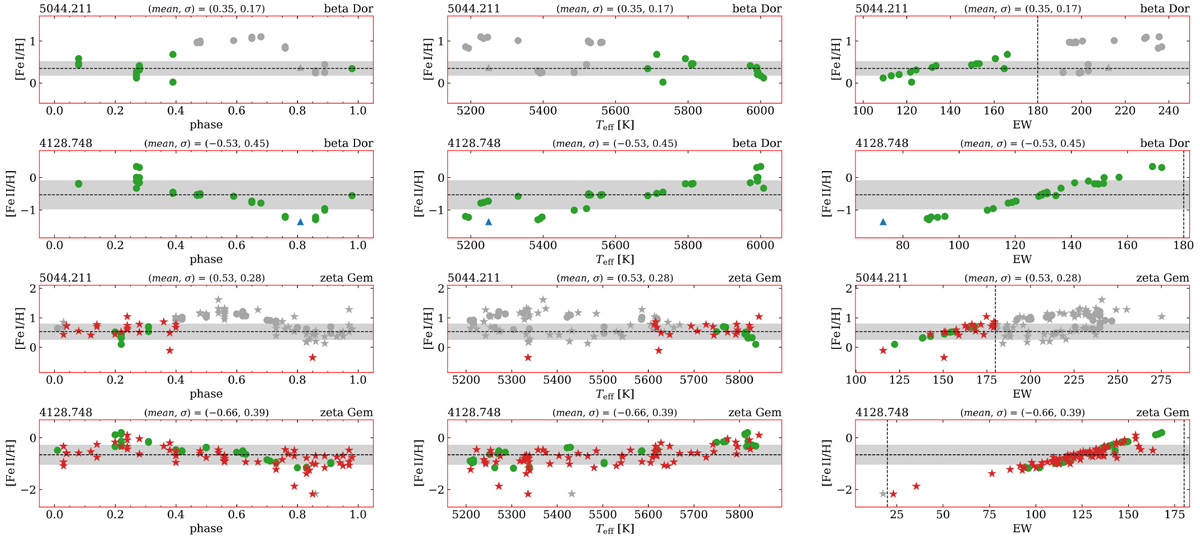
Fig. A.1
Download original image
Iron abundances as a function of the pulsation phase, effective temperature, and equivalent width for lines excluded from the initial line list. These examples, for HARPS (green circles), FEROS (blue triangle), and STELLA (red stars) spectra of β Dor and ζ Gem, show a dependence of the abundances on the equivalent widths possibly caused by blends. Lines too weak or too strong (probably saturated) are represented by light gray symbols. The hatched regions around the dashed lines indicate the 1-σ uncertainty around the mean.
Current usage metrics show cumulative count of Article Views (full-text article views including HTML views, PDF and ePub downloads, according to the available data) and Abstracts Views on Vision4Press platform.
Data correspond to usage on the plateform after 2015. The current usage metrics is available 48-96 hours after online publication and is updated daily on week days.
Initial download of the metrics may take a while.