Fig. 12
Download original image
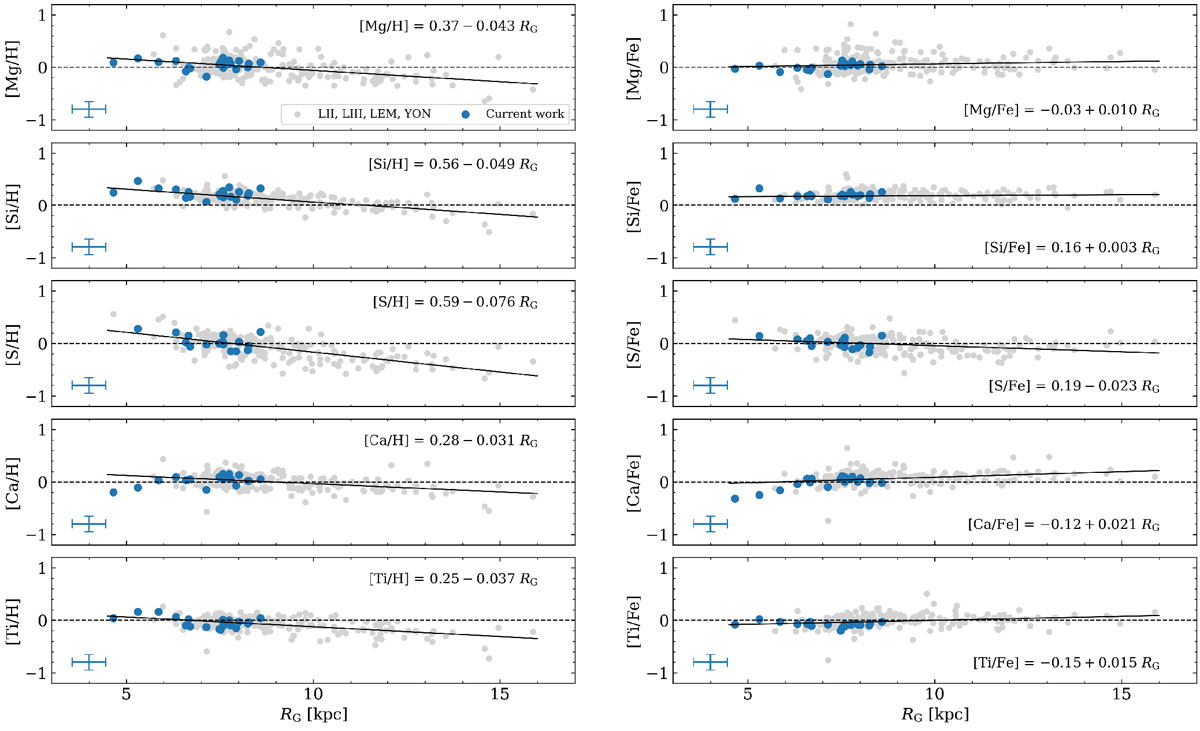
[X/H] and [X/Fe] abundance ratios as a function of the Galactocentric distance (RG) for our 20 calibrating Cepheids compared with stars from literature: LII: Luck et al. (2011); LIII: Luck & Lambert (2011); LEM: Lemasle et al. (2013); YON: Yong et al. (2006). The error bars indicate our typical errors. Linear regressions fitted to the entire sample are also shown (solid lines)
Current usage metrics show cumulative count of Article Views (full-text article views including HTML views, PDF and ePub downloads, according to the available data) and Abstracts Views on Vision4Press platform.
Data correspond to usage on the plateform after 2015. The current usage metrics is available 48-96 hours after online publication and is updated daily on week days.
Initial download of the metrics may take a while.