Fig. 1
Download original image
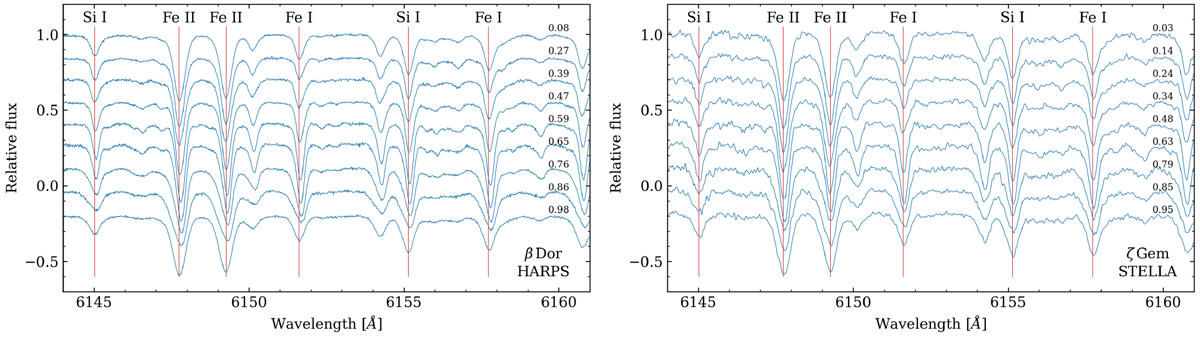
Examples of high-resolution spectra for the stars β Dor and ζ Gem in different pulsation phases (values on the right side of each panel). The vertical red lines indicate the position in the rest-frame wavelength of atomic lines either used only for the abundance determination or also adopted by the LDR method. For the sake of clarity, the continuum of each spectrum was shifted to arbitrary levels.
Current usage metrics show cumulative count of Article Views (full-text article views including HTML views, PDF and ePub downloads, according to the available data) and Abstracts Views on Vision4Press platform.
Data correspond to usage on the plateform after 2015. The current usage metrics is available 48-96 hours after online publication and is updated daily on week days.
Initial download of the metrics may take a while.