Fig. 8.
Download original image
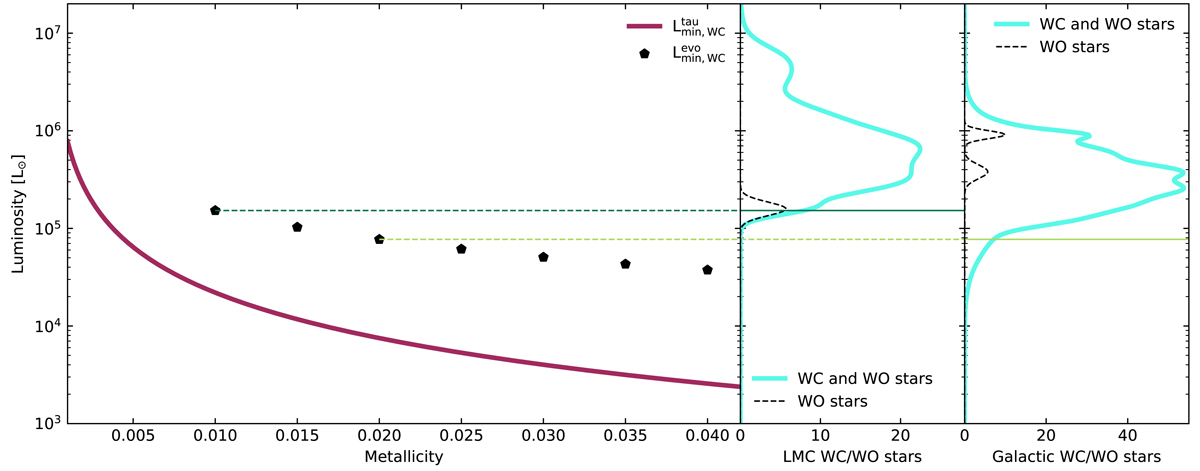
Analytical and numerical predictions of the minimum luminosity of WC- and WO-type stars as a function of metallicity, compared with observed populations. The solid line in the left panel shows the minimum luminosity at which WC stars are predicted to be observable as a function of metallicity, according to Eq. (8). The black pentagons indicate the minimum luminosity at which our stellar models expose their carbon- and oxygen-enriched layers. The panels to the right show the observed luminosity distribution of WC and WO stars in the LMC (Hainich et al. 2014) and in the Galaxy (Sander et al. 2019). The horizontal lines compare the minimum luminosity carbon- and oxygen-rich stars produced in our models at Z = 0.01 and Z = 0.02 with the observed distributions in the LMC and the Galaxy, respectively.
Current usage metrics show cumulative count of Article Views (full-text article views including HTML views, PDF and ePub downloads, according to the available data) and Abstracts Views on Vision4Press platform.
Data correspond to usage on the plateform after 2015. The current usage metrics is available 48-96 hours after online publication and is updated daily on week days.
Initial download of the metrics may take a while.