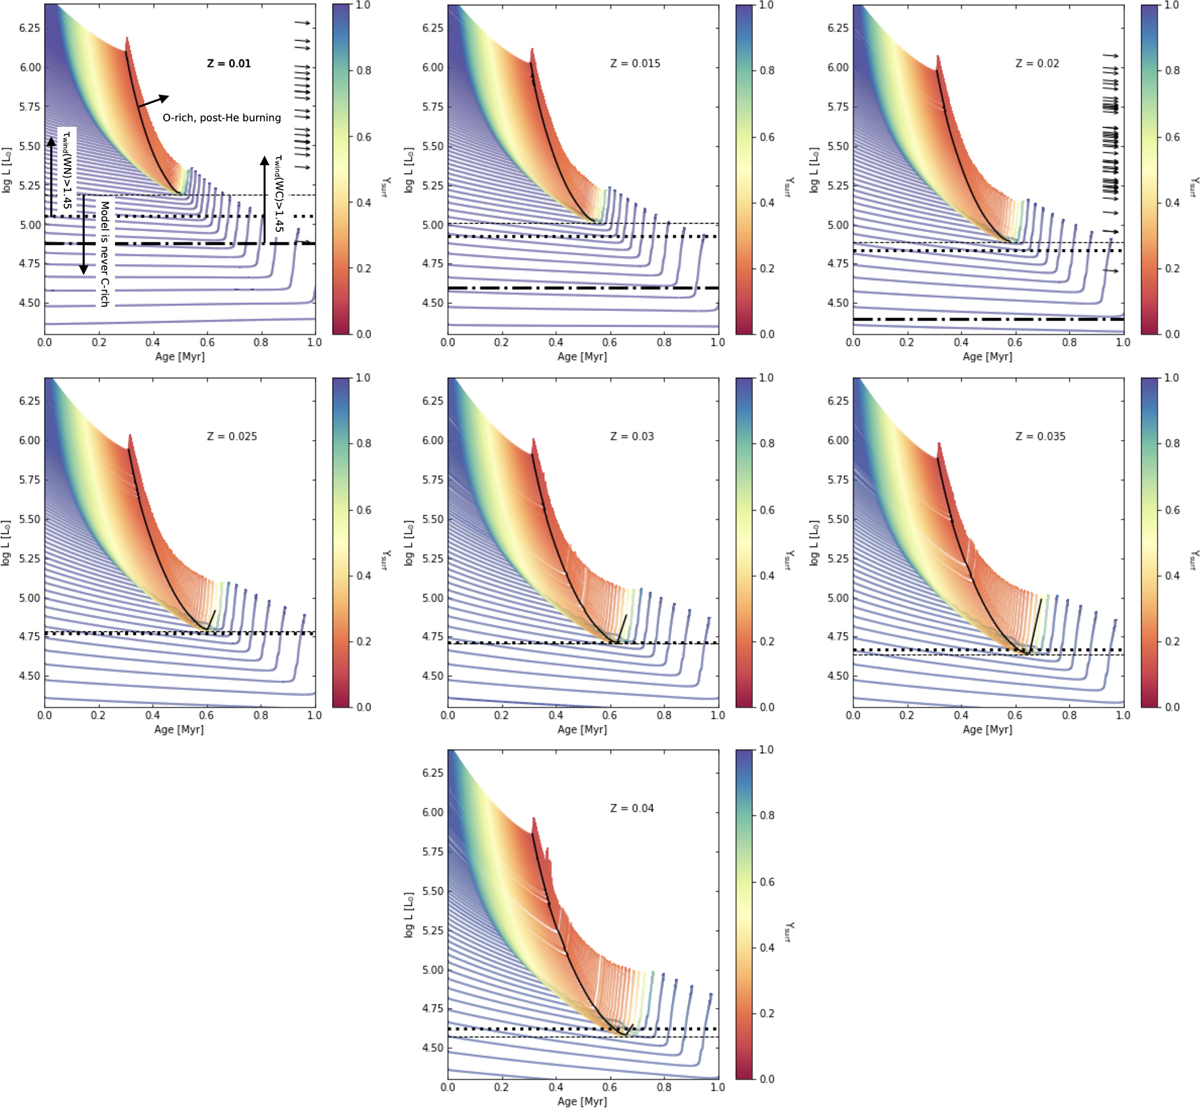
Fig. 6.
Download original image
Evolution of surface luminosity as a function of age, between the He-ZAMS and core carbon depletion, for helium star models with different initial masses, coloured by surface helium abundance. Each panel represents a set of models with different metallicity, from 0.01 (top left) to 0.04 (bottom). Arrows on the right side of the panel with Z = 0.01 represent the luminosities of observed WC stars in the LMC, inferred from the sample of Bartzakos et al. (2001), assuming a bolometric correction of Mbol = 4.5 (e.g. Moffat 1989; Smith et al. 1994), and have typical uncertainties of 0.3 dex. Arrows on the right side of the panel with Z = 0.02 represent the luminosities of observed WC stars in the Galaxy, taken from Sander et al. (2019). The thin horizontal dashed lines represent the minimum luminosity at which carbon-rich models are formed at each metallicity, ![]() . The solid black lines indicate the moment at which stellar models end core helium burning, and have surface oxygen abundance higher than 0.05. The horizontal thick dotted lines indicate the minimum luminosity at which the optical depth of nitrogen-rich stripped-envelope stars is expected to be higher than 1.45, according to Eq. (7). The horizontal thick dash-dotted lines indicate the minimum luminosity at which the optical depth of carbon-rich stripped-envelope stars is expected to be higher than 1.45, according to Eq. (8).
. The solid black lines indicate the moment at which stellar models end core helium burning, and have surface oxygen abundance higher than 0.05. The horizontal thick dotted lines indicate the minimum luminosity at which the optical depth of nitrogen-rich stripped-envelope stars is expected to be higher than 1.45, according to Eq. (7). The horizontal thick dash-dotted lines indicate the minimum luminosity at which the optical depth of carbon-rich stripped-envelope stars is expected to be higher than 1.45, according to Eq. (8).
Current usage metrics show cumulative count of Article Views (full-text article views including HTML views, PDF and ePub downloads, according to the available data) and Abstracts Views on Vision4Press platform.
Data correspond to usage on the plateform after 2015. The current usage metrics is available 48-96 hours after online publication and is updated daily on week days.
Initial download of the metrics may take a while.