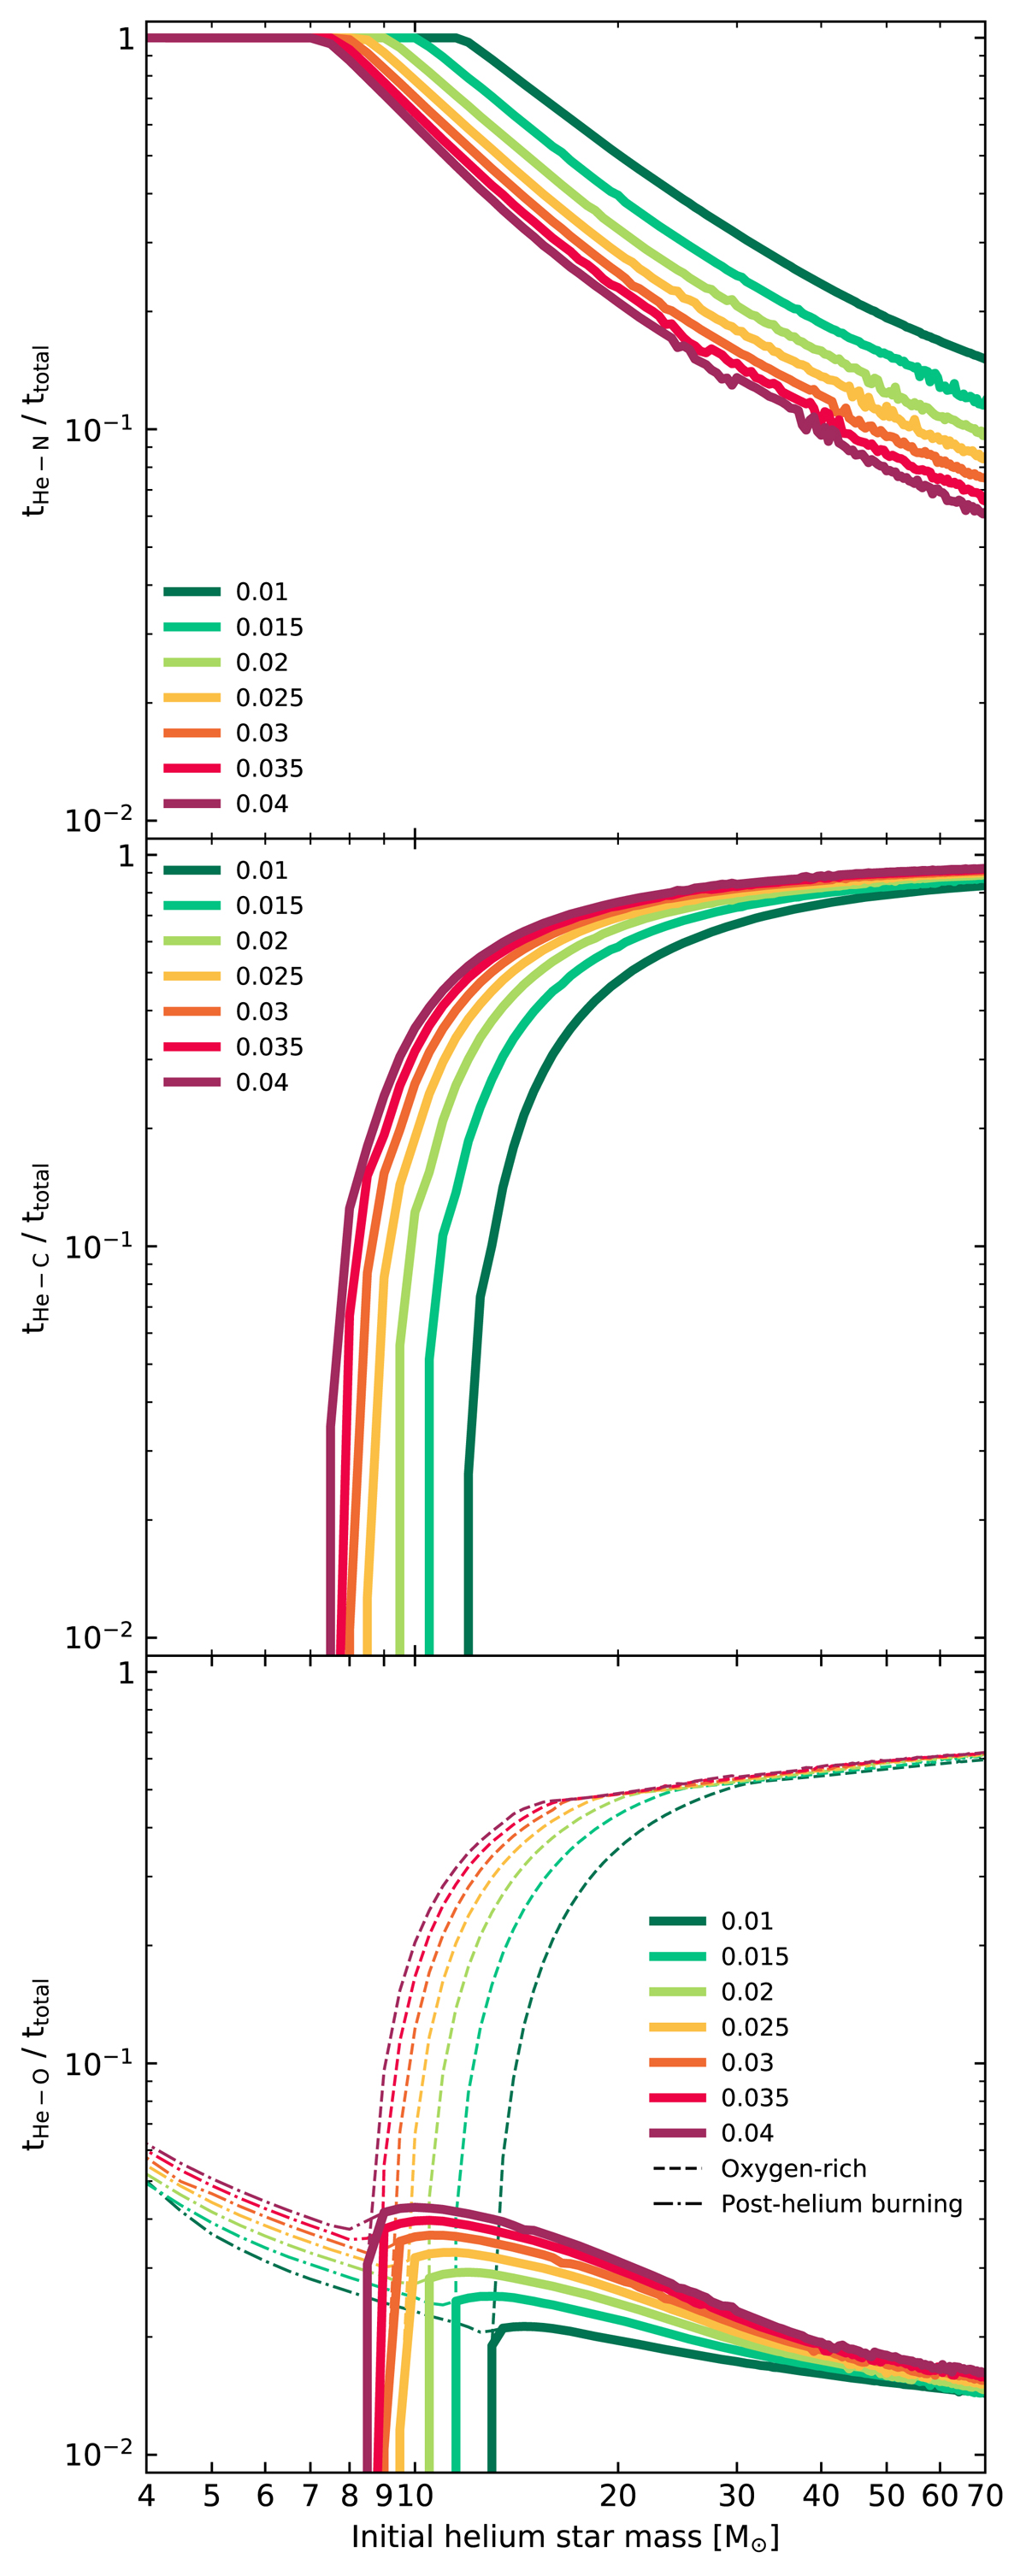
Fig. 5.
Download original image
Ratios of lifetimes of different evolutionary phases to total lifetime as a function of initial mass, for helium stars of different metallicities. Top panel: ratio of the time spent with a nitrogen-rich envelope to total lifetime. Middle panel: ratio of time spent with a carbon-rich envelope to total lifetime. Bottom panel: ratio of lifetime spent with an envelope with surface oxygen abundance higher than 0.05 after core helium burning to the total lifetime. The dashed lines in the bottom panel indicate the ratios of the lifetime spent with an envelope with surface oxygen abundance higher than 0.05 to the total lifetime, and the dot-dashed lines indicate the ratios of the lifetime after core helium depletion to the total lifetime.
Current usage metrics show cumulative count of Article Views (full-text article views including HTML views, PDF and ePub downloads, according to the available data) and Abstracts Views on Vision4Press platform.
Data correspond to usage on the plateform after 2015. The current usage metrics is available 48-96 hours after online publication and is updated daily on week days.
Initial download of the metrics may take a while.